Nicole Drakos
Research Blog
Welcome to my Research Blog.
This is mostly meant to document what I am working on for myself, and to communicate with my colleagues. It is likely filled with errors!
This project is maintained by ndrakos
Results for JWST Proposal Part III
This is a continuation of this post, in which I plotted the galaxy catalog on top of the dark matter density slice.
I am now going to look into adding reionization bubbles.
Characteristic Bubble Size
Reference: Furlanetto and Oh, 2005.
Bubbles have a characteristic size, that depends on the redshift as well as \(\zeta\) (which is a constant that includes many things, including ionizing photon production, escape fraction of ionizing photons, star formation efficiency, ect.)
As bubbles grow, their characteristic size, \(R_{\rm char}\) approaches a maximum size \(R_{\rm max}\) (the point at which recombinations balance ionizations). FO05 suggests that this size is ~20 comoving Mpc.
For now I will set the characteristic size to 20 Mpc for both redshift 7 and 9.
Smoothed with Gaussian
I guess I will smooth the dark matter mass density with a Gaussian with a standard deviation of 10 Mpc.
This is easy to do in python: scipy.ndimage.gaussian_filter(input, sigma,mode='wrap',truncate=1) (I used the mode ‘wrap’ since the simulation has periodic BCs, and I truncated it at one standard deviation: also note that sigma should be in units of the number of pixels)
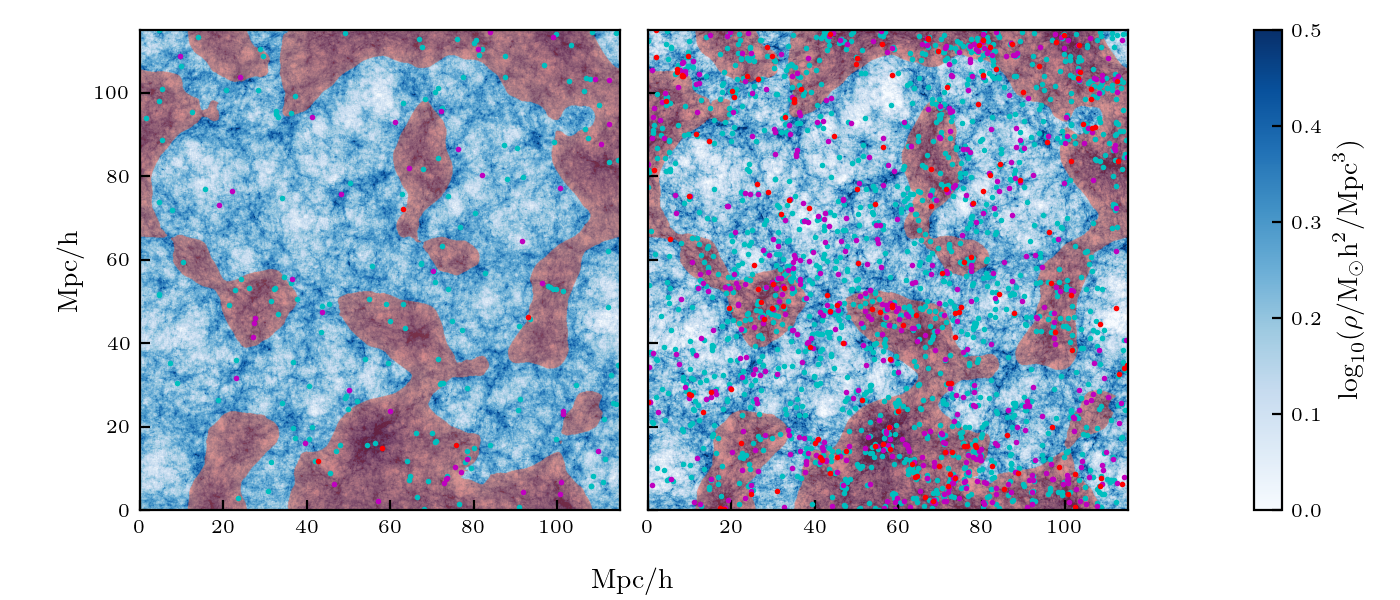
Here is the smoothed image:

Ionized Regions
I made the smoothed distribution transparent when the smoothed density was less than a threshold, which I arbitrarily picked to be 0.28 (see the above plot). If I plot this in red over the previous plot:
