Nicole Drakos
Research Blog
Welcome to my Research Blog.
This is mostly meant to document what I am working on for myself, and to communicate with my colleagues. It is likely filled with errors!
This project is maintained by ndrakos
A Closer Look At Beta Part II
This is a continuation of the previous post.
Test Point
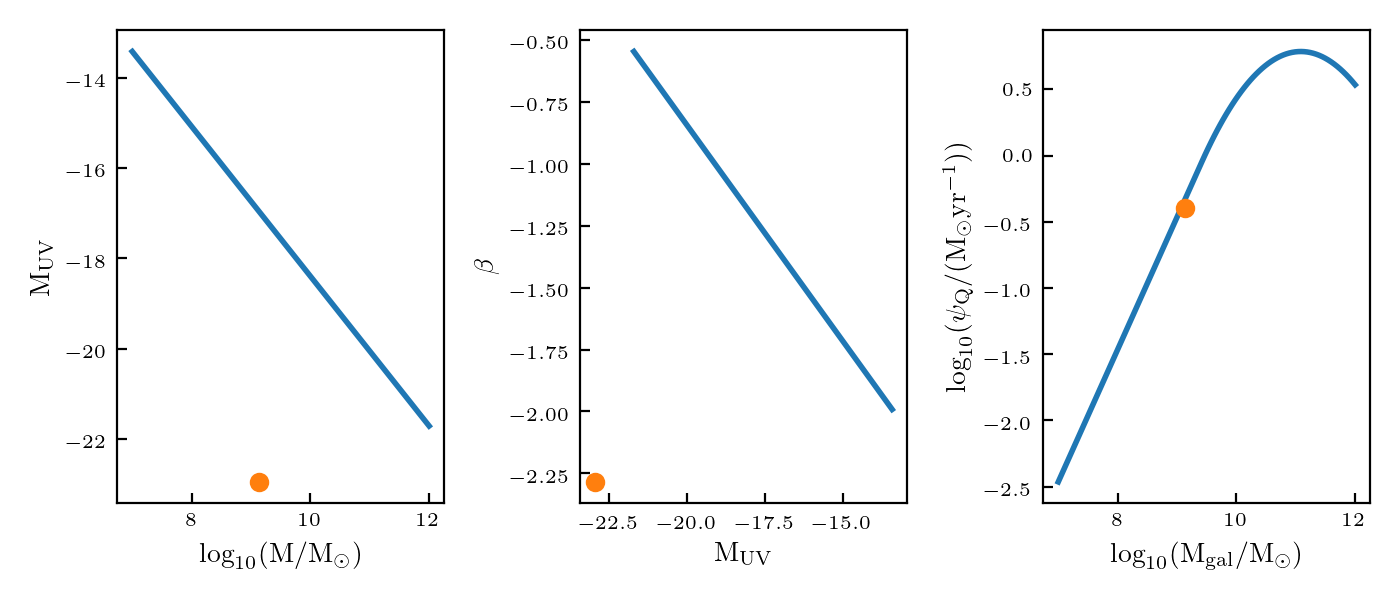
In the previous post, I showed that the UV slopes, \(\beta\) appeared to be correctly calculated. However, there were some strange objects. I am going to look at the brightest object in the previous post; it has a \(M_{UV}=-22\) and \(\beta=-2.28\)
From the previous post, it indicates that the star formation rate is too high; however, when I compare this point to the expected star formation rate (right-most plot), it falls right on the relation:

The things I want to check are:
1) Am I calculating \(M_{UV}\) correctly?
2) Am I normalizing the spectra correctly?
3) Is my SFR–mass relationship correct?
4) Am I implementing the correct SFR into the FSPS code?
1) \(M_{UV}\)
I am calculating \(M_{UV}\) by taking the average \(f_{\nu}\) in the range \(\lambda=1450-1500\) Angstroms.
There are numerous places in that calculation I could have made an error with e.g. unit conversions. However, I realized fsps contains an idealized filter at 1500 (i1500) that should calculate basically the same thing. I tested this, to make sure I am calculating the magnitude correctly, and it gave the same answer as my code.
Therefore, I am fairly confident that my \(M_{UV}\) calculation is correct.
2) Spectra
FSPS returns spectra that are normalized such that there is one stellar mass created over the entire SFH. To correct for this, I multiply the flux by the galaxy mass, and divide by stellar_mass (which is the surviving stellar mass). This seems correct to me, and I am not sure if there is a to test it.
3) SFR–mass relation
I am assigning the SFR from the relationship shown in the above plot, with some scatter. Clearly, I am assigning the SFR value correctly, however it is possible that my relation is wrong.
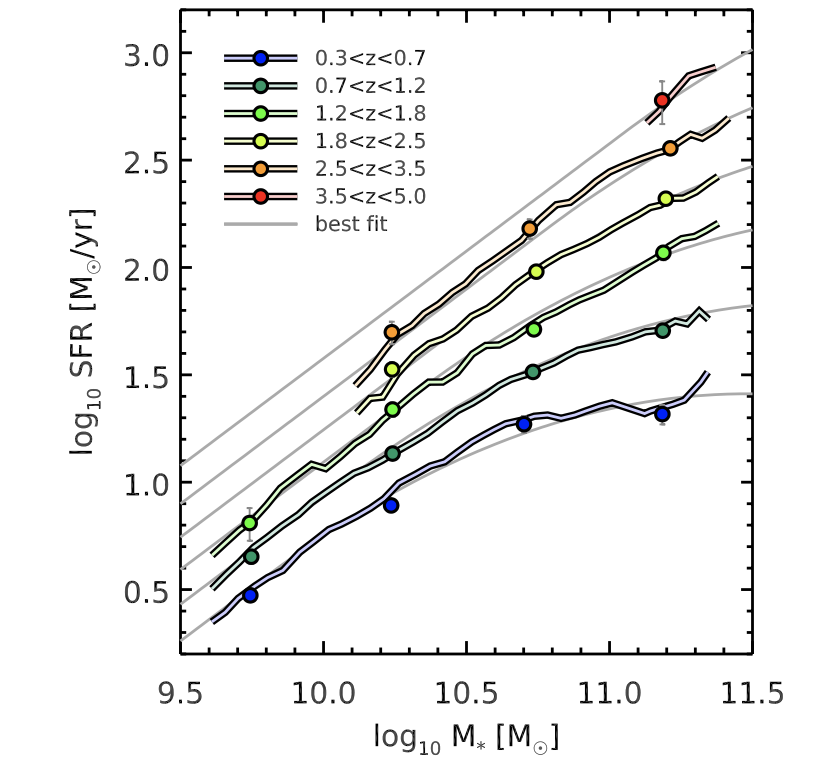
The SFR–mass relation is from Schreiber et al 2017, eq 10, as described in this post). They also provide a plot in their 2015 paper. If I compare the SFR–mass relation to this plot:

it seems that my relationship looks correct.
4) SFR assignment in FSPS
The SFR not explicitly set in FSPS, but I use it (along with the age of the stellar population) to calculate the e-folding time, as described here.
I went through the calculation, and could not find any problems.
**Use tau in catalog to calculate SFR, make sure it is consistent… other ways to check?
One thing that is strange about this object is that it is much younger than the other galaxies… I have assigned it an age of \(0.03\) Gyr. This galaxy is unrealistically young. In order to match the SFR, it has an e-folding time of 0.1 (which is the minimum I allow… which means it might not actually be matching the assigned SFR)…