Nicole Drakos
Research Blog
Welcome to my Research Blog.
This is mostly meant to document what I am working on for myself, and to communicate with my colleagues. It is likely filled with errors!
This project is maintained by ndrakos
A Closer Look At Beta Part IV
This is a continuation of this post.
Previous \(\beta-M_{\rm UV}\) Relation
We have been having issues reproducing the expected \(\beta\)–\(M_{\rm UV}\) trends. I fixed a problem where some galaxies were accidentally being assigned really high SFRs, but it didn’t change the \(\beta\)–\(M_{\rm UV}\) problem.
As a reminder, here is a plot that shows the issue (note that this plot, and all the following in this post are only for star-forming galaxies):
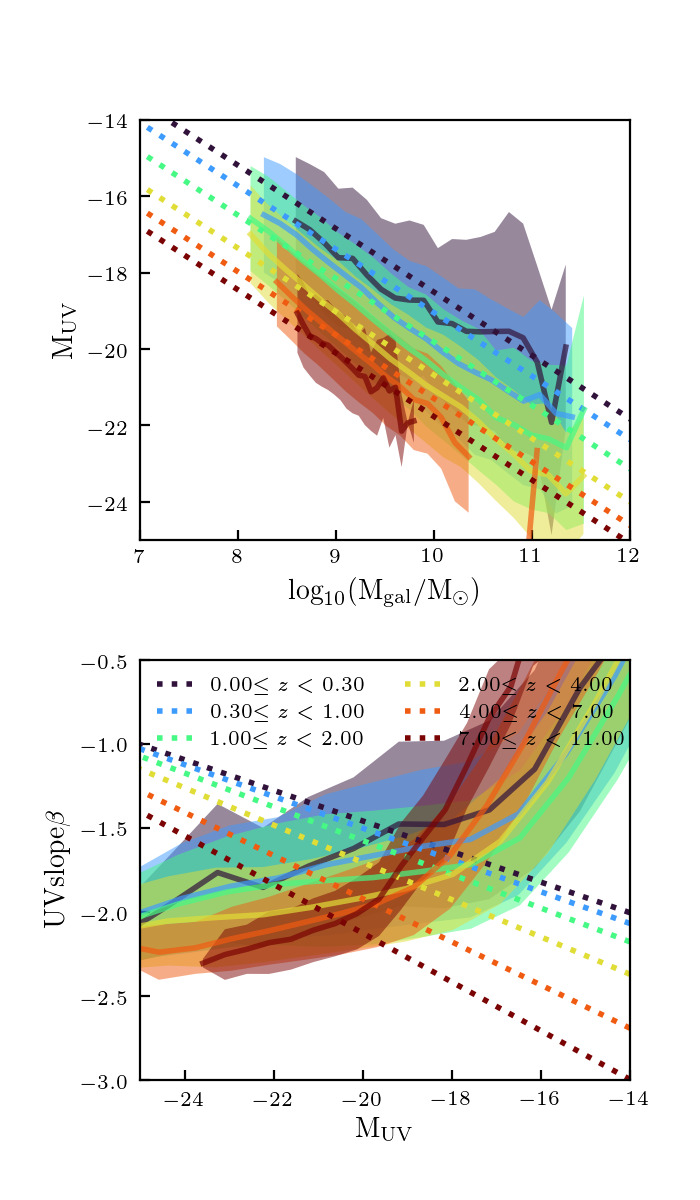
The dotted lines are the expected trends from W18, and the solid lines are my mock galaxies.
Reject/Accept Method
Since the age distributions I was using to assign galaxy ages weren’t well motivated, I changed the SED assignment as follows:
Galaxy ages were selected uniformly between \(10^6\) years and the age of the universe.
Once an SED was assigned, I chose two random numbers between 0 and 1, and then accepted/rejected the galaxy properties based on the PDF of (1) a gaussian centred at the expected mass–\(M_{\rm UV}\) and (2) a gaussian centred at the expected \(M_{\rm UV}\)–\(\beta\) relation (with the standard deviations chosen to be consistent with the expected relations.) Ideally, this would reproduce the expected trends, but since the UV properties are non-linear and depend on a combination of many parameters, the UV properties are not uniformly distributed, and therefore we are not guaranteed to produce the target distributions.
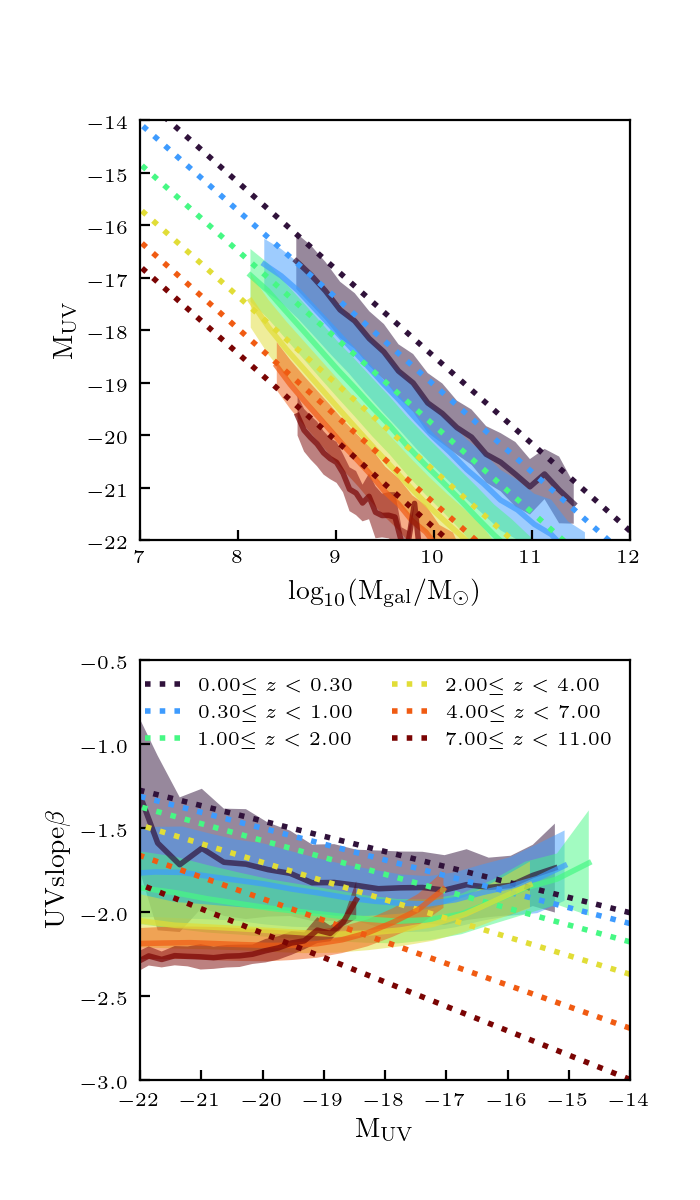
The resulting relations from this method are shown in this plot:
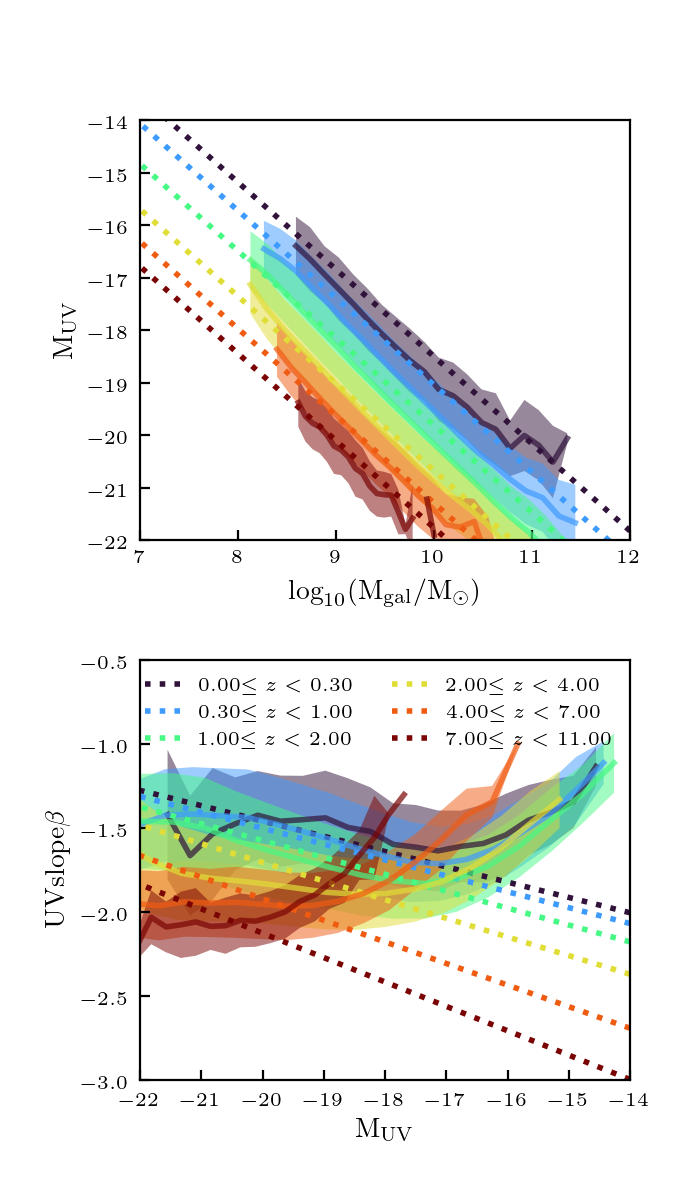
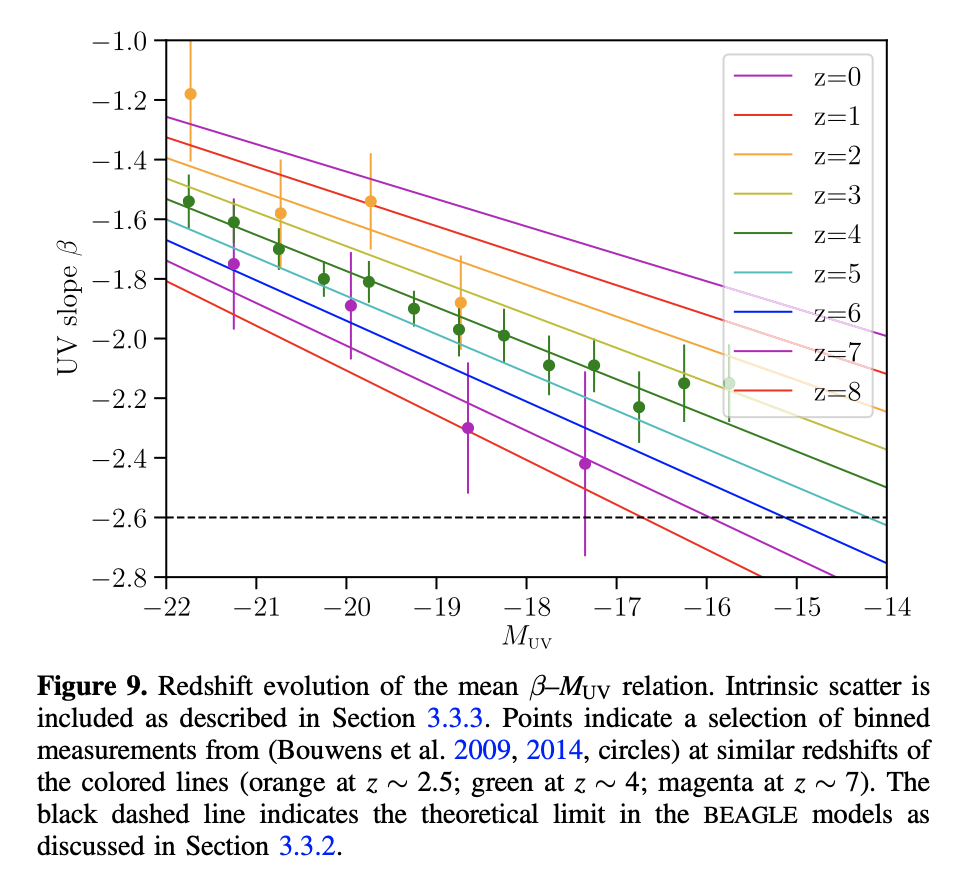
This looks a lot better than before, particularly for low redshifts. However constraints for beta-MUV mainly at \(z=4\) see for example W18 plot.
I am not too worried about the uptick in the trend, because I am hoping it is a mass resolution issue (these are the \(512^3\) simulations)… these faint galaxies are much more massive than typical for their magnitudes, so might not follow the relation. E.g. the redshift 0 galaxies are incomplete below magnitudes of \(-17\), which is where the \(\beta--M_UV\) relation begins to turn up. However, this is something I need to check.
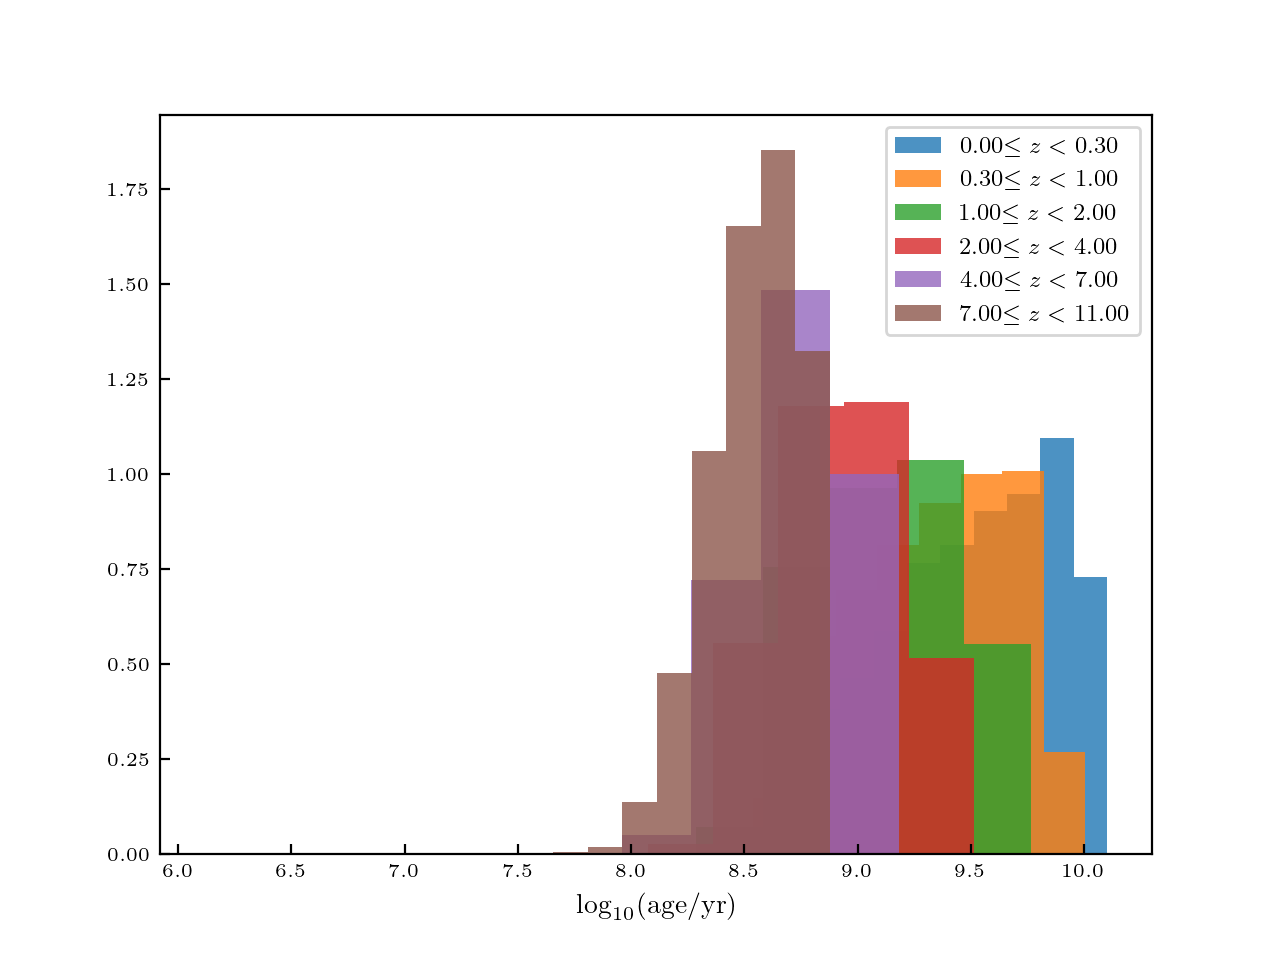
It is also interesting to look at the resulting age distributions:
Effect of Dust
Overall, \(\beta\) should mainly depend on age, metallicity, and dust. Brighter, more massive galaxies are older, have higher metallicities and more dust and are therefore redder (shallower slopes).
To see the affect of dust, I set the dust parameter to zero, and otherwise kept the same method here is the resulting plot:
Clearly this is a lot worse, with the galaxies being too bright with steeper UV slopes. I need to figure out how to compare my results to observations of dust properties in order to see if my dust parameters are reasonable. Interestingly, the upturn in the relation is not as pronounced though, so maybe this is not solely a resolution issue.