Nicole Drakos
Research Blog
Welcome to my Research Blog.
This is mostly meant to document what I am working on for myself, and to communicate with my colleagues. It is likely filled with errors!
This project is maintained by ndrakos
Abundance Matching More Thoughts
I have been thinking a bit about the plot below—why does the SMF not quite match at the high mass end?
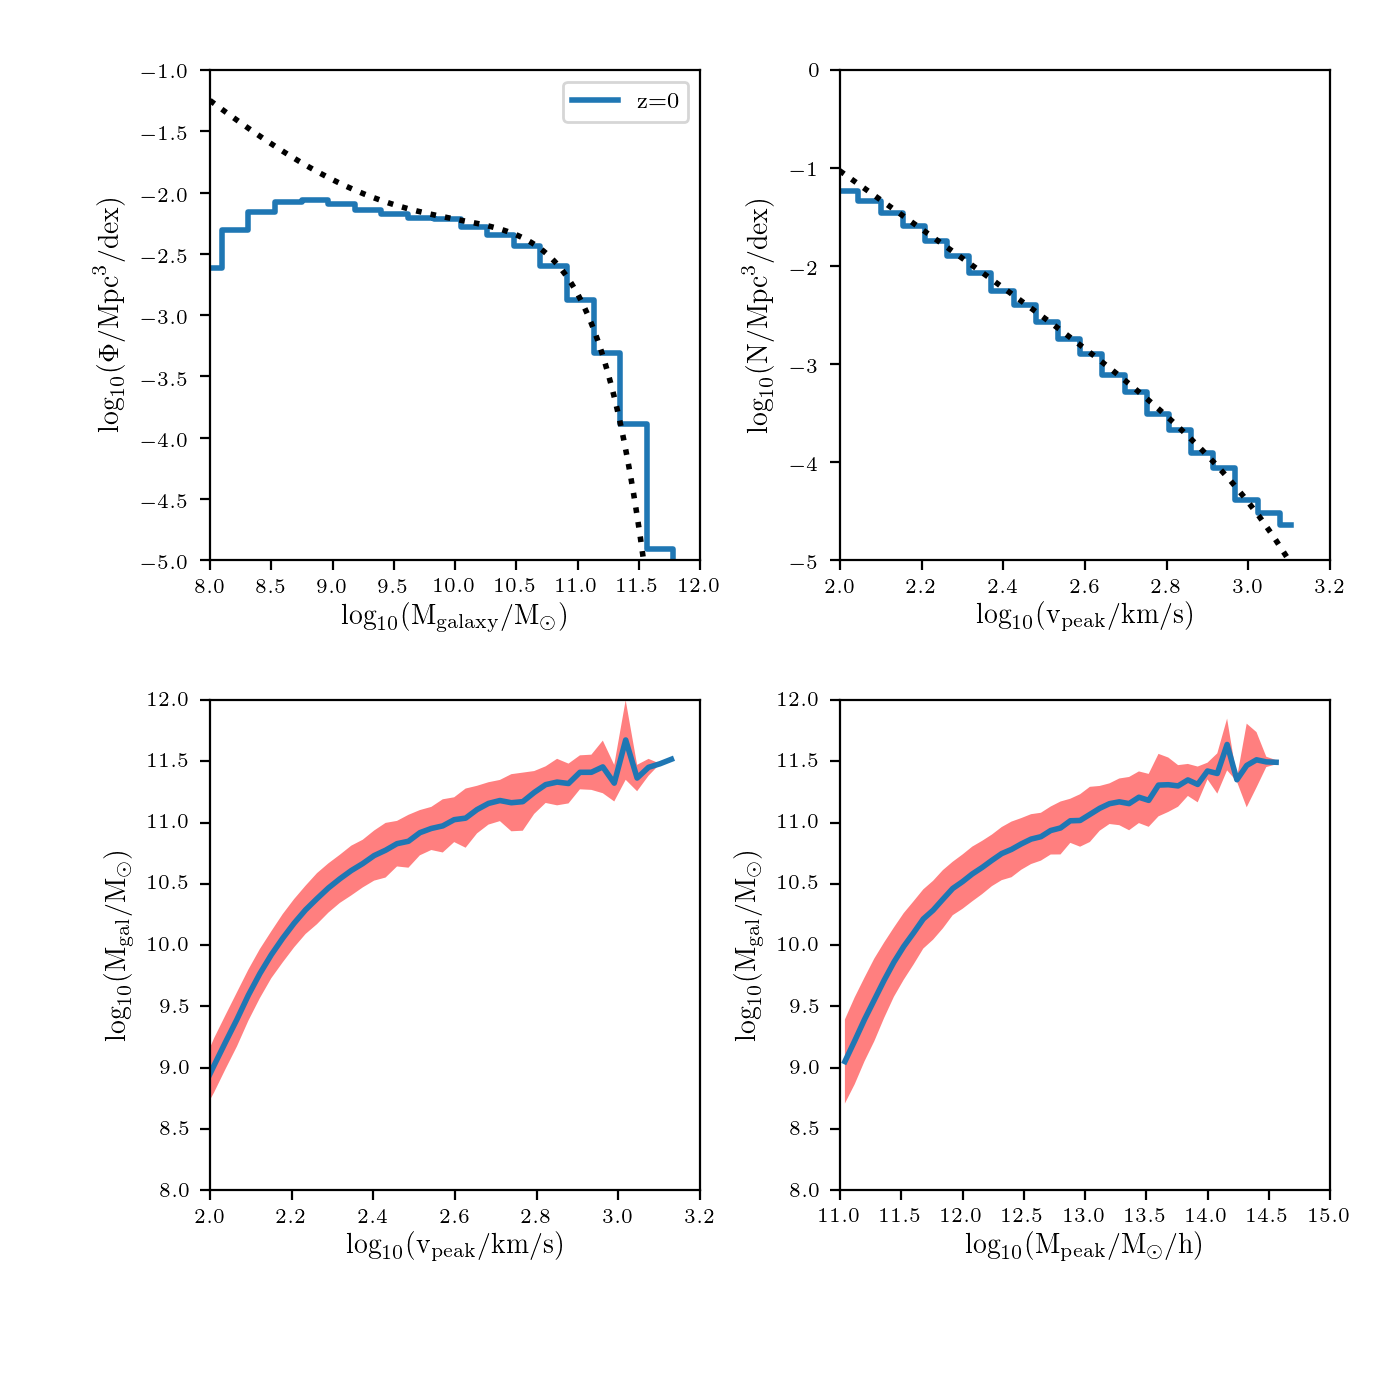
Thinking about this more, this is because once scatter is added to the \(v_{\rm peak}\) values, the HVF of the simulation data changes. This is not what I want.
Therefore, as an update to the method, rather than match the scattered \(v_{\rm peak}\) values to the galaxy mass exactly (by solving \(\int_x^\infty n(x') dx' = \int_{M_*}^\infty \phi (M_*') dM_*’\)), I instead randomly generate \(M_{\rm gal}\) values from the SMF, and then rank order the resulting masses—this ensures the SMF is preserved.
This requires setting a minimum mass in the SMF: Therefore, I only consider \(v_{\rm peak}\) values above \(2.1 \, \rm{dex}\) (this value was chosen, since for the \(512^3\) simulation the HVF looks incomplete below this limit). Then, solving \(\int_x^\infty n(x') dx' = \int_{M_*}^\infty \phi (M_*') dM_*’\), this sets the minimum galaxy mass to be \(9.79\).
Current Abundance Matching Implementation
BASIC ABUNDANCE MATCHING PROCEDURE
-
Get the minimum galaxy mass (corresponding to the minimum \(v_{\rm peak}\) value)
-
Randomly generate \(N\) \(M_{\rm gal}\) values so that they match the SMF (where \(N\) is the number of halos with \(v_{\rm peak}\) above the minimum value)
-
Rank-order the galaxy masses, and assign them to each halo (so that the halo with the largest \(v_{\rm peak}\) has the largest galaxy masses)
GENERATE A MAPPING IN THE SCATTER
-
Randomly generate \(10^7\) \(v_{\rm peak}\) values from the HVF function (I am using a minimum \(v_{\rm peak}\) value of 1.5 dex for this step)
-
Loop through different fixed scatter values in \(v_{\rm peak}\): I am using 100 values linearly spaced between 0 and 0.5.
-
For a given scatter value, add guassian errors to the \(v_{\rm peak}\) values
-
Perform abundance matching (as outlined above) using these scattered values
-
Bin the resulting masses, and measure the scatter in \(M_{\rm gal}\) as a function of \(v_{\rm peak}\)
-
Repeat steps 3-5 for each scatter value
ABUNANCE MATCHING WITH SCATTER
-
Choose a constant scatter in \(M_{\rm gal}\)
-
For each vpeak value use the mapping from above to get the corresponding scatter in \(v_{\rm peak}\)
-
Add scatter to the \(v_{\rm peak}\) values, and use these scattered values to perform the abundance matching step
Results
Here is the updated plot:
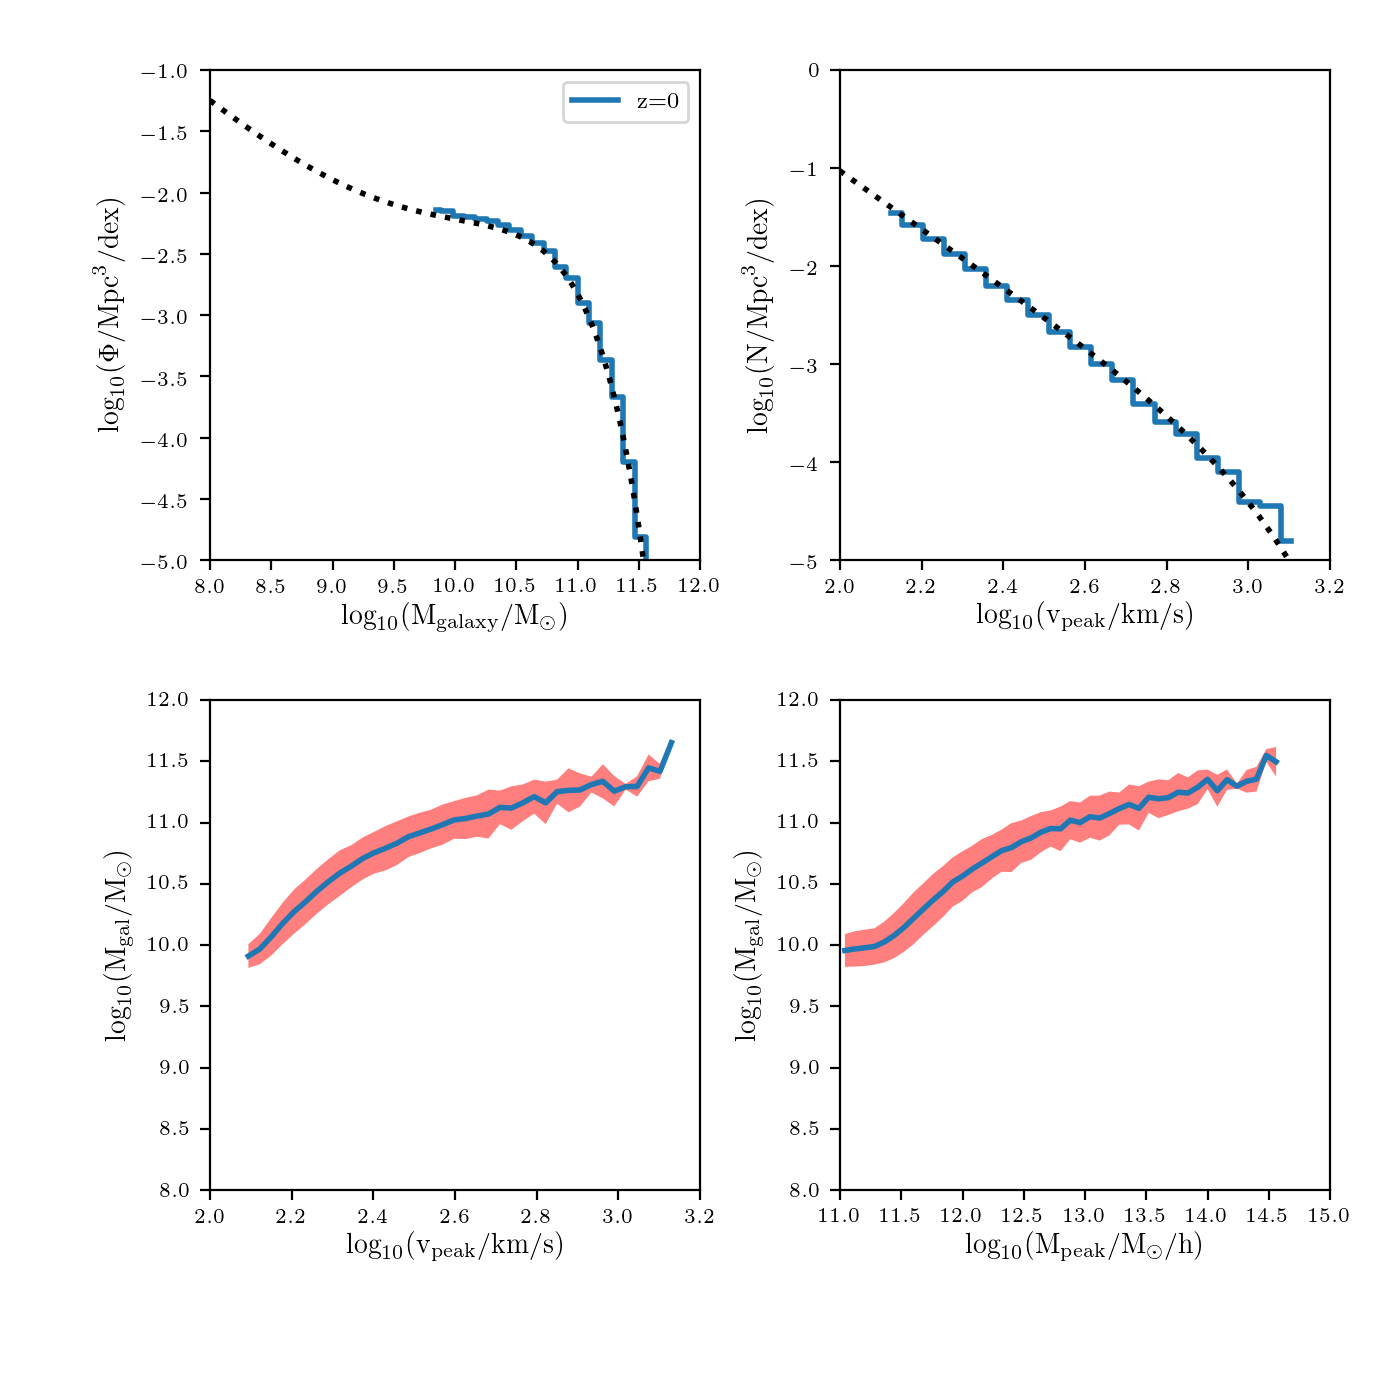
The SMF looks better, but the stellar mass–\(M_{\rm peak}\) relation looks worse… I think this is just a resolution issue though, and I expect it will look better with the 1024 simulations.