Nicole Drakos
Research Blog
Welcome to my Research Blog.
This is mostly meant to document what I am working on for myself, and to communicate with my colleagues. It is likely filled with errors!
This project is maintained by ndrakos
Check SEDs
I have assigned SEDs to all the galaxies, as outlined in my previous post.
In this post I am doing some checks to see if these SEDs are reasonable.
Distribution of Free Parameters
First, I simply plot the distribution of the different parameters used to calculate the SEDs. These parameters are age \(a\), star-formation time \(\tau\), the SFR \(\psi\), metallicity \(Z\), dust attenuation \(\bar{\tau}_V\) and gas ionization parameter \(U_S\).
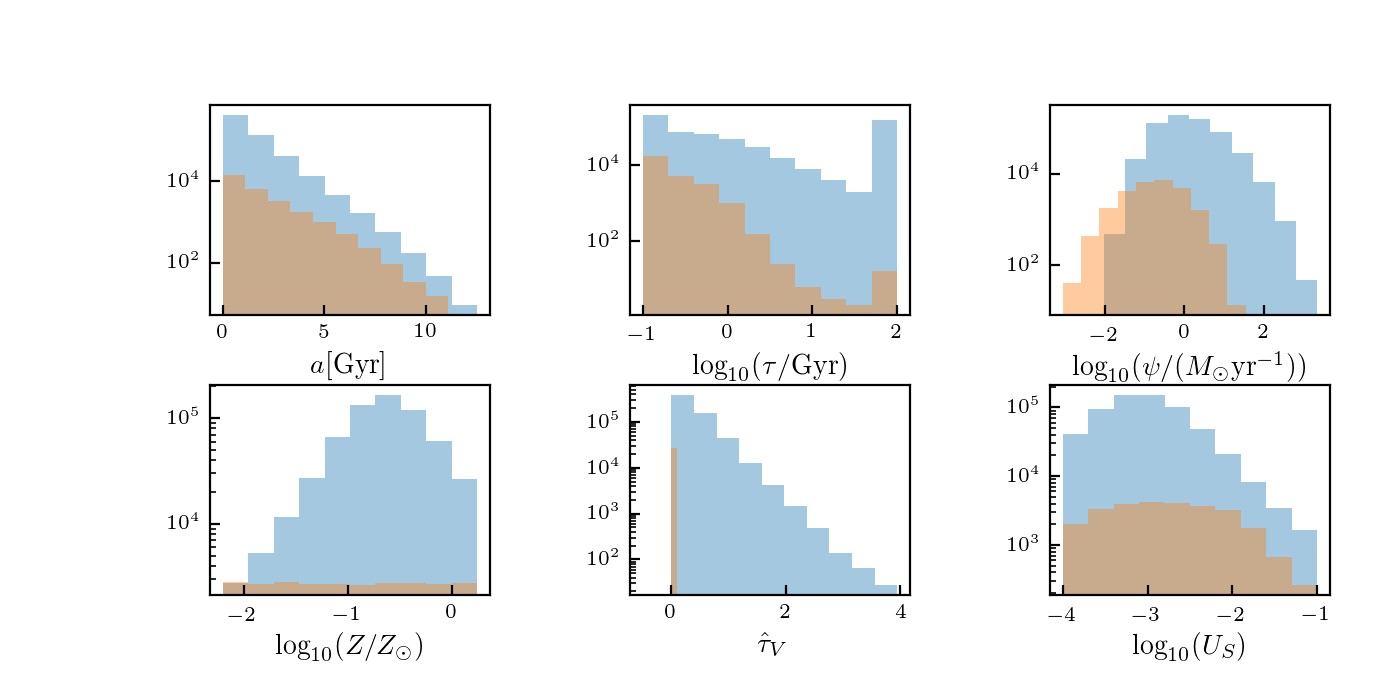
These values make sense with what was imposed.
Star Formation Rates
The SFRs were imposed from relations in Shreiber et al. 2017.
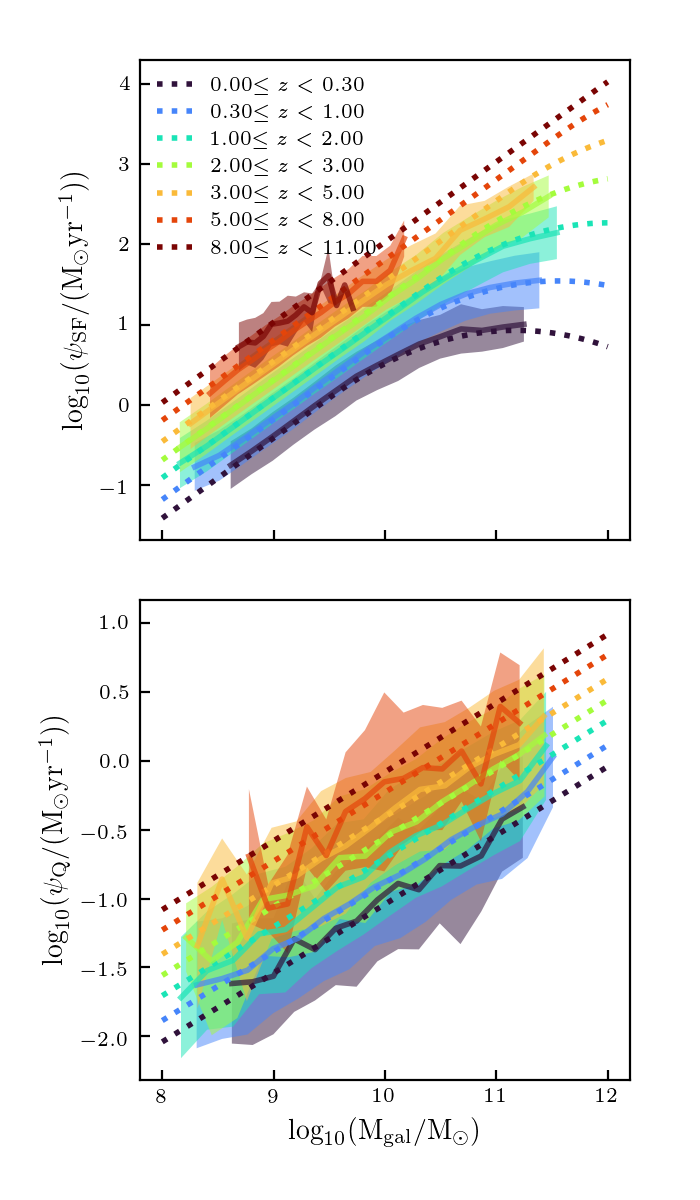
These look like they were assigned correctly
\(Z\)-\(U_S\) Relation
This was imposed (Eq 18 in W18).
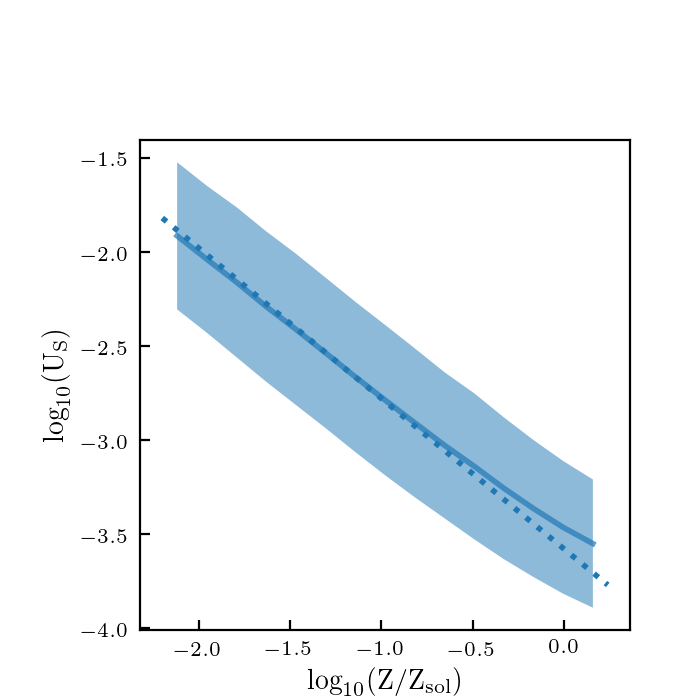
This looks pretty good. It is a bit above the relation for high Z, I’m guessing because of the truncation I placed in the distribution (if I didn’t place a truncation, I would occasionlly end up with galaxies with incredibly unrealistic \(Z\) and/or \(U_S\) values).
UV properties
Unlike W18 I did NOT impose these relations. Therefore I compare the recovered \(M\)–\(M_{\rm UV}\) and \(M_{\rm UV}\)–\(\beta\) relations (as calculated here) to those used in W18 (dotted lines). Note that this only includes SF galaxies.
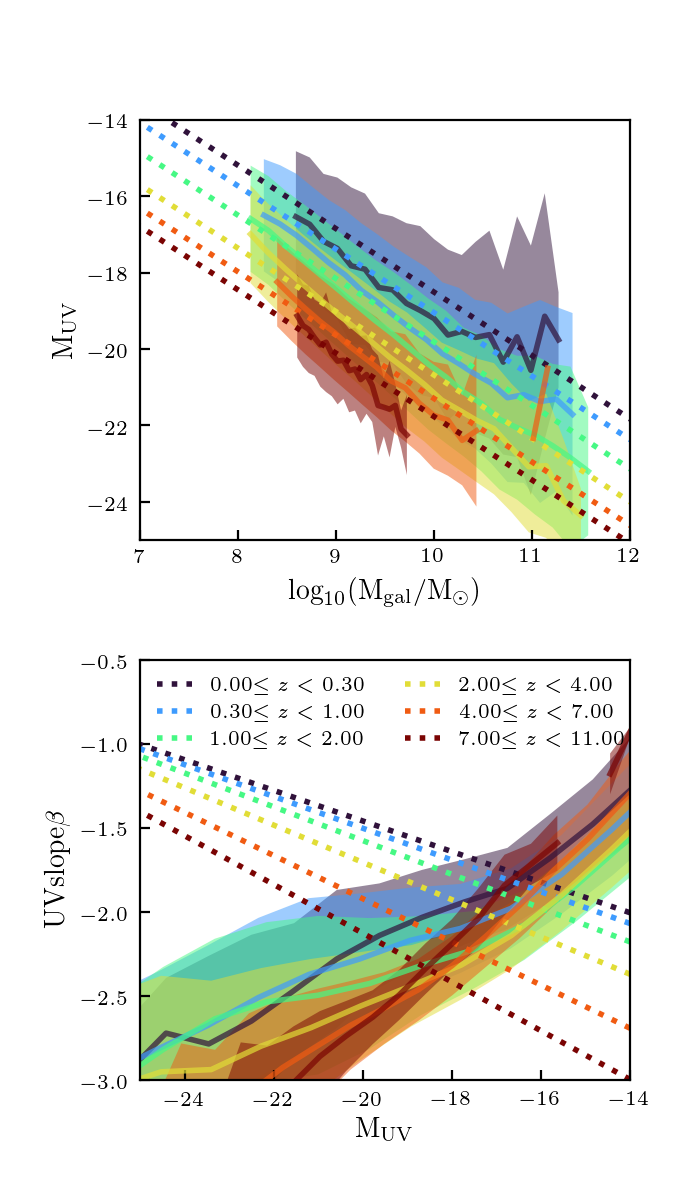
The \(M\)–\(M_{\rm UV}\) looks fairly similar to the relation from W18 and has the proper dependance on redshift, though our objects seem to be slightly brighter, and the slopes slightly steeper.
The \(M_{\rm UV}\)–\(\beta\) relation does not behave as expected. While the \(\beta\) values look reasonable, the trend with \(M_{\rm UV}\) is backwards. I am hoping that this is a problem with how I am calculating \(\beta\)—I plan to double check this later.
UVJ diagram
I also got FSPS to return the magnitudes in the Johnson U and V bands (calculated from the SEDs). This is so I can plot the galaxies in a UVJ diagram, and check that the SF and Q classifications are consistent with the colours.
Taking galaxies with redshifts \(z<1\), this is what the UVJ diagram looks like
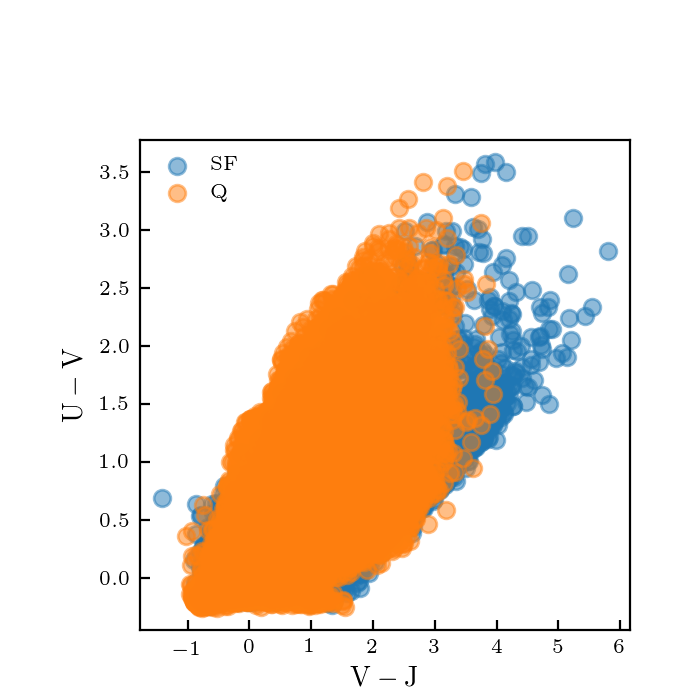
This doesn’t look great, but I think it is mostly because I didn’t take the restframe U,V and J values. When I restrict it to galaxies with \(z<0.2\) it is a bit better:
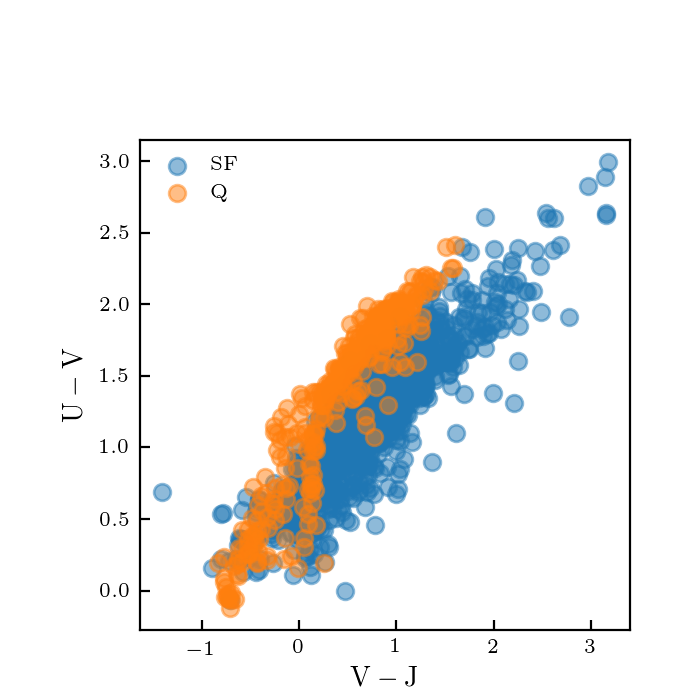
However, there do seem to be more quiescent galaxies in the lower left corner than expected.
I should actually get the restframe filters instead to check this.
Summary
This mostly looks reasonable, the only worrisome thing is the \(M_{\rm UV}\)–\(\beta\) relation. I need to try and make sense of this, and figure out how to make the results look more reasonable.
I also want to plot observational data on top of these trends. Other things I can check against data are the star formation rate density (e.g. Fig 18 in W18), and the sSFR (Fig 19 in W18).