Nicole Drakos
Research Blog
Welcome to my Research Blog.
This is mostly meant to document what I am working on for myself, and to communicate with my colleagues. It is likely filled with errors!
This project is maintained by ndrakos
Light Cone Abundance Matching
I have done abundance matching on the \(512^3\) simulation light cone to assign galaxy masses to each halo. There are still some things to sort out, but these are my preliminary results.
Results
The theoretical curves are given with dashed lines (when known) and the data with solid lines; the shaded area gives the \(1\, \sigma\) error bars:
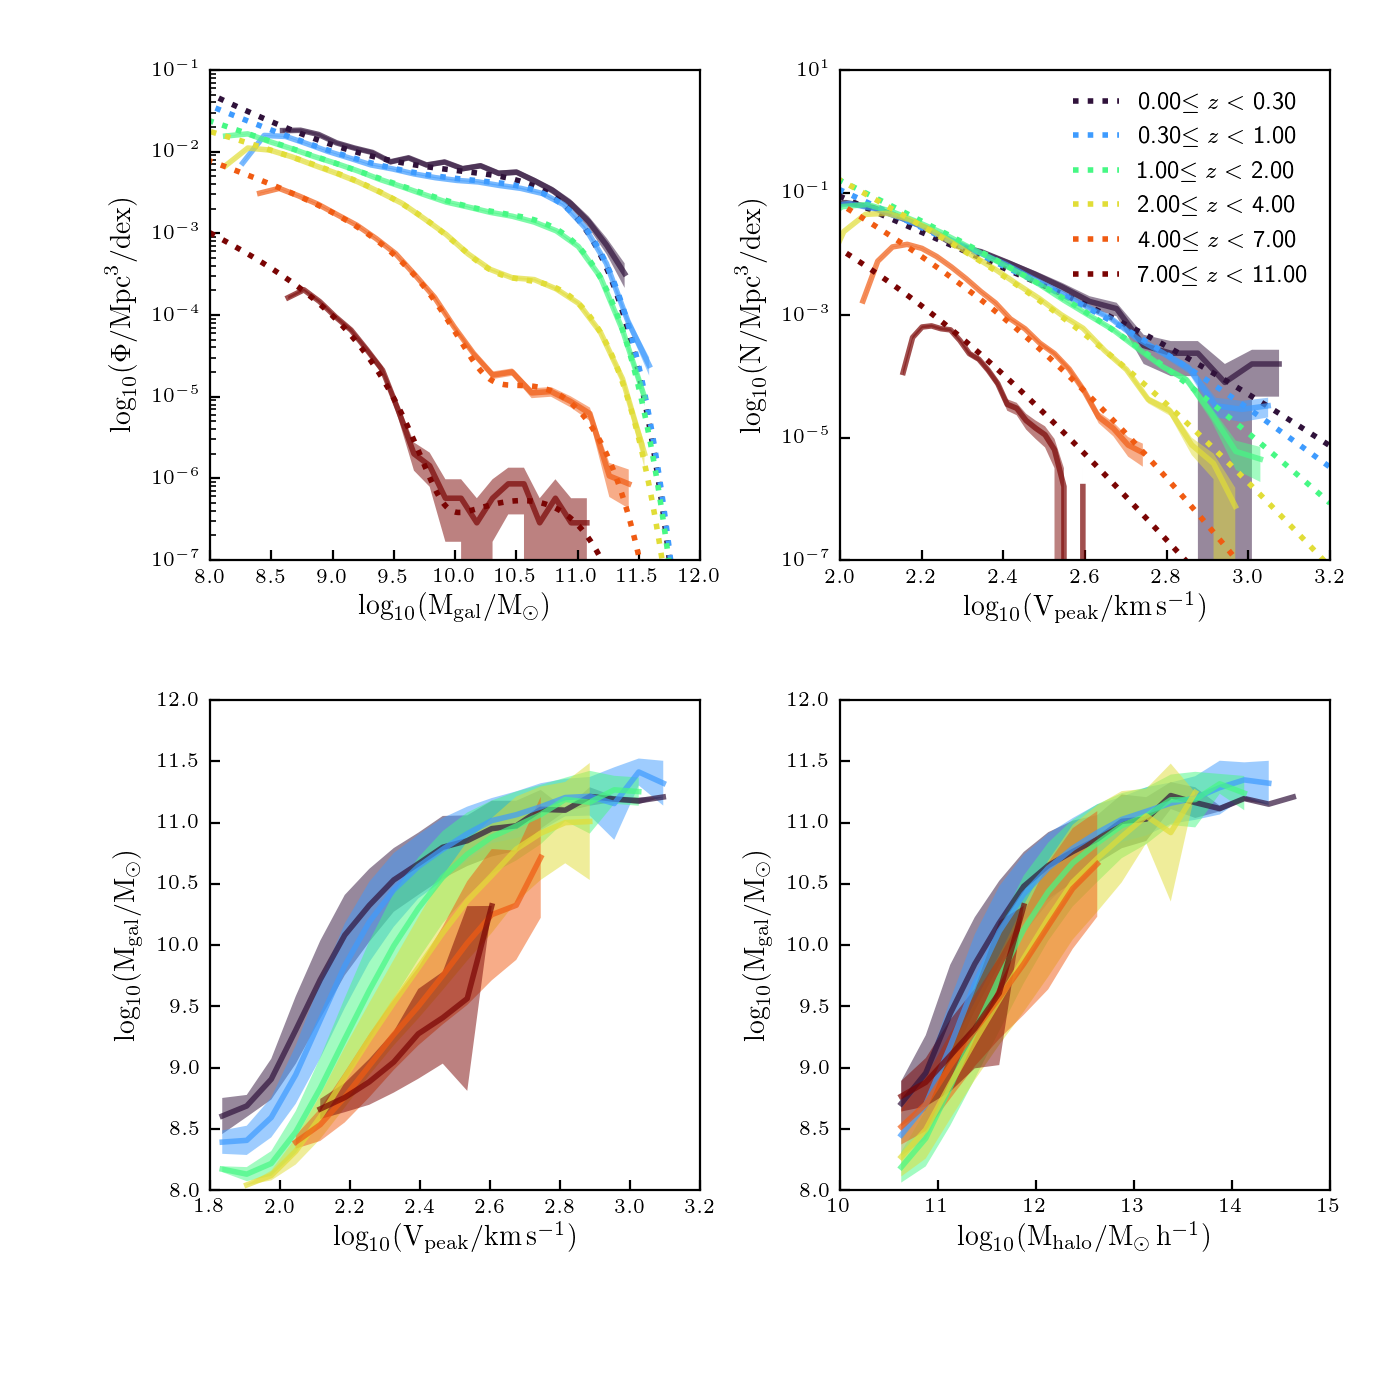
Stellar Mass Function
The scatter method I am using should preserve the SMF exactly, which is why there is excellent agreement between the theoretical SMF and the light cone SMF. The SMF seems to be a little high for low redshifts; this may be because of the low volume in this redshift range, but the error bars don’t seem to agree with this… I need to double check that things make sense for this range.
Another thing to think about is whether the shape of these SMFs is reasonable, particularly for high redshifts. The form is from Williams et al. 2018. Here is their plot with data:
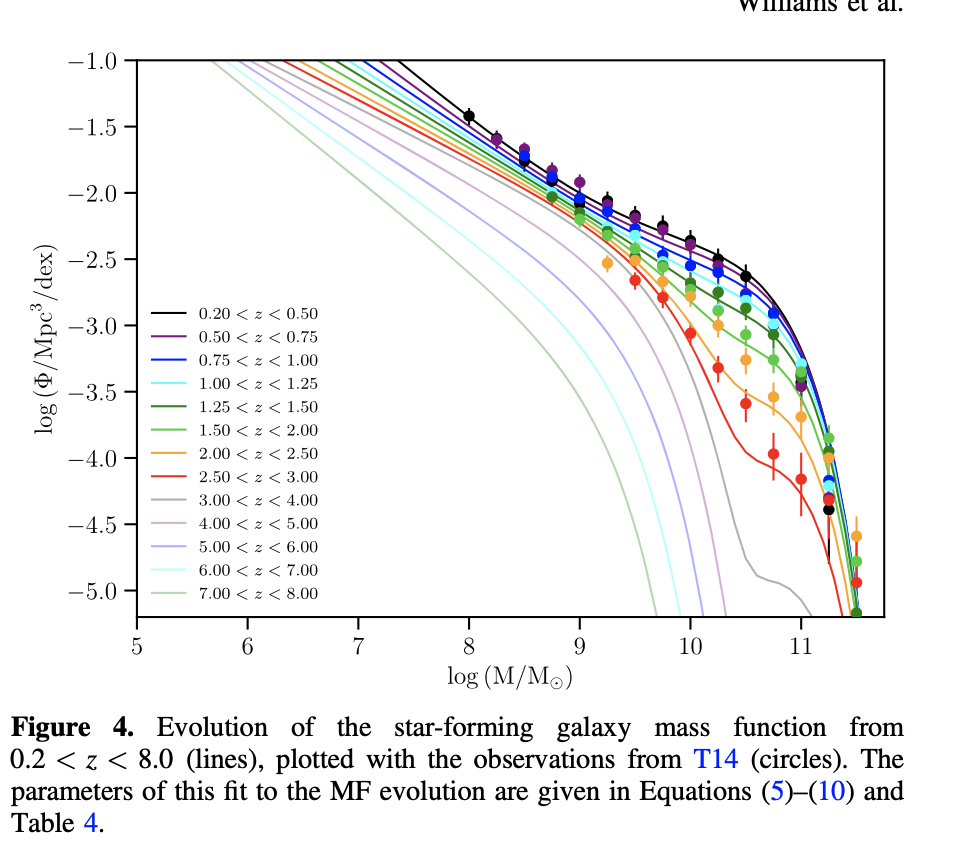
There doesn’t seem to be good evidence for the high redshift SMFs, so maybe I should alter this.
Halo Vpeak Function
The second panel shows the HVFs measured from the simulations compared to the fit I have for the HVFs. Right now the high redshifts don’t agree in the abundance matching procedure, but that’s because I only fit the parameterization out to redshift \(7.4\):
I need to update these fits, and extend them to higher redshifts.
Stellar Mass–Vpeak Relation
The third panel shows the relation between the galaxy masses and the halo \(v_{\rm peak}\) values.
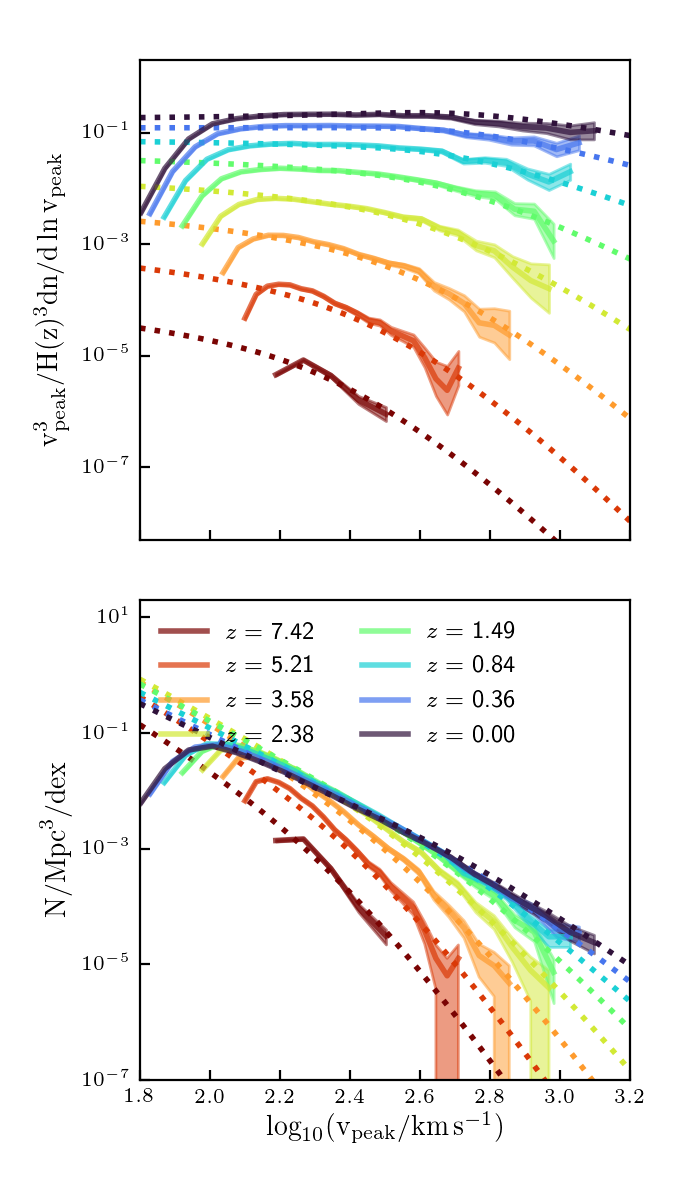
Galaxy masses are a little higher than expected at low vpeaks… see for example this plot from Cao et al. 2019:
This could be partially because we are using a different SMF, but it is probably mostly because we aren’t resolving enough lower mass haloes; really shouldn’t trust the shape below \(\log_{10}(V_{\rm peak}) = 2.2\,{\rm dex}\). This will improve with the higher resolution simulations.
Stellar Mass–Halo Mass Function
Finally, the last panel shows the stellar mass–halo mass relation.I want to check if these relations look reasonable. To do this, I’m going to compare to this paper: Girelli et al. 2020.
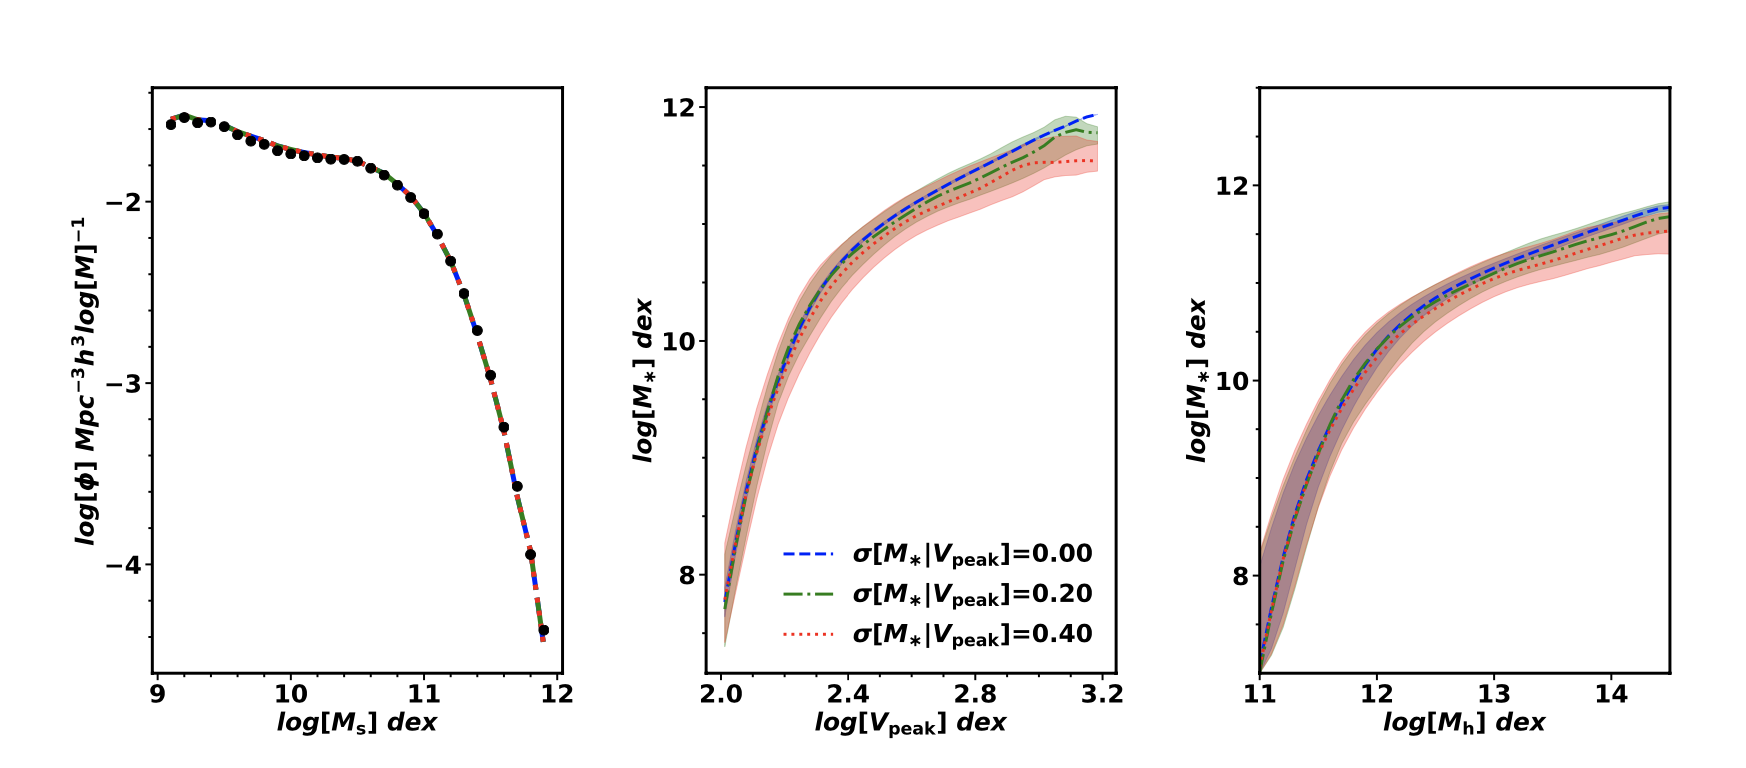
Scatter
To get the scatter in this relation, I roughly used the scatter mapping for redshift 0 (since I am having issues getting it to work for higher redshifts). I set it up so that it should give a scatter \(\sigma [M_{\rm gal}\rvert V_{\rm peak}]=0.2\, \rm{dex}\).
With the current plots, I have the following scatter:
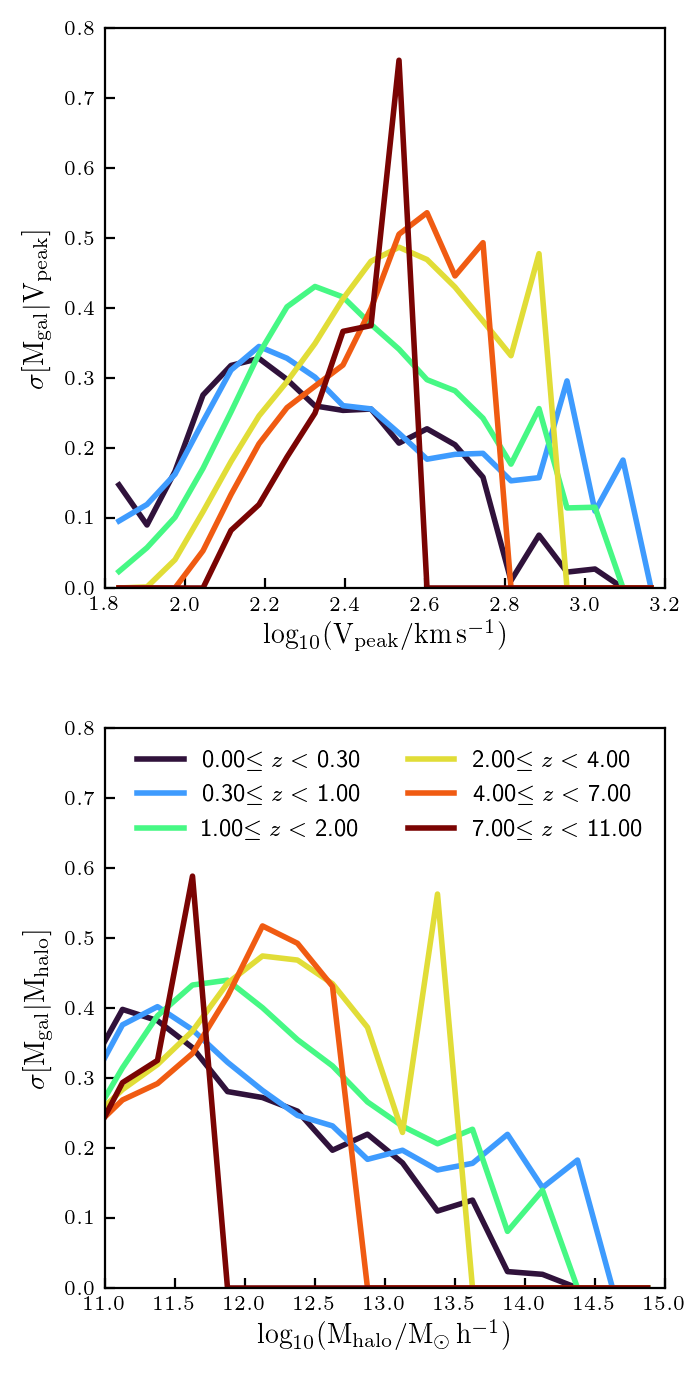
Clearly, this isn’t constant at 0.2 as I tried to implement. However, I really only roughly estimated the mapping between \(V_{\rm peak} = 2.1\) and \(2.8\) for redshift zero.
If we compare to current constaints on
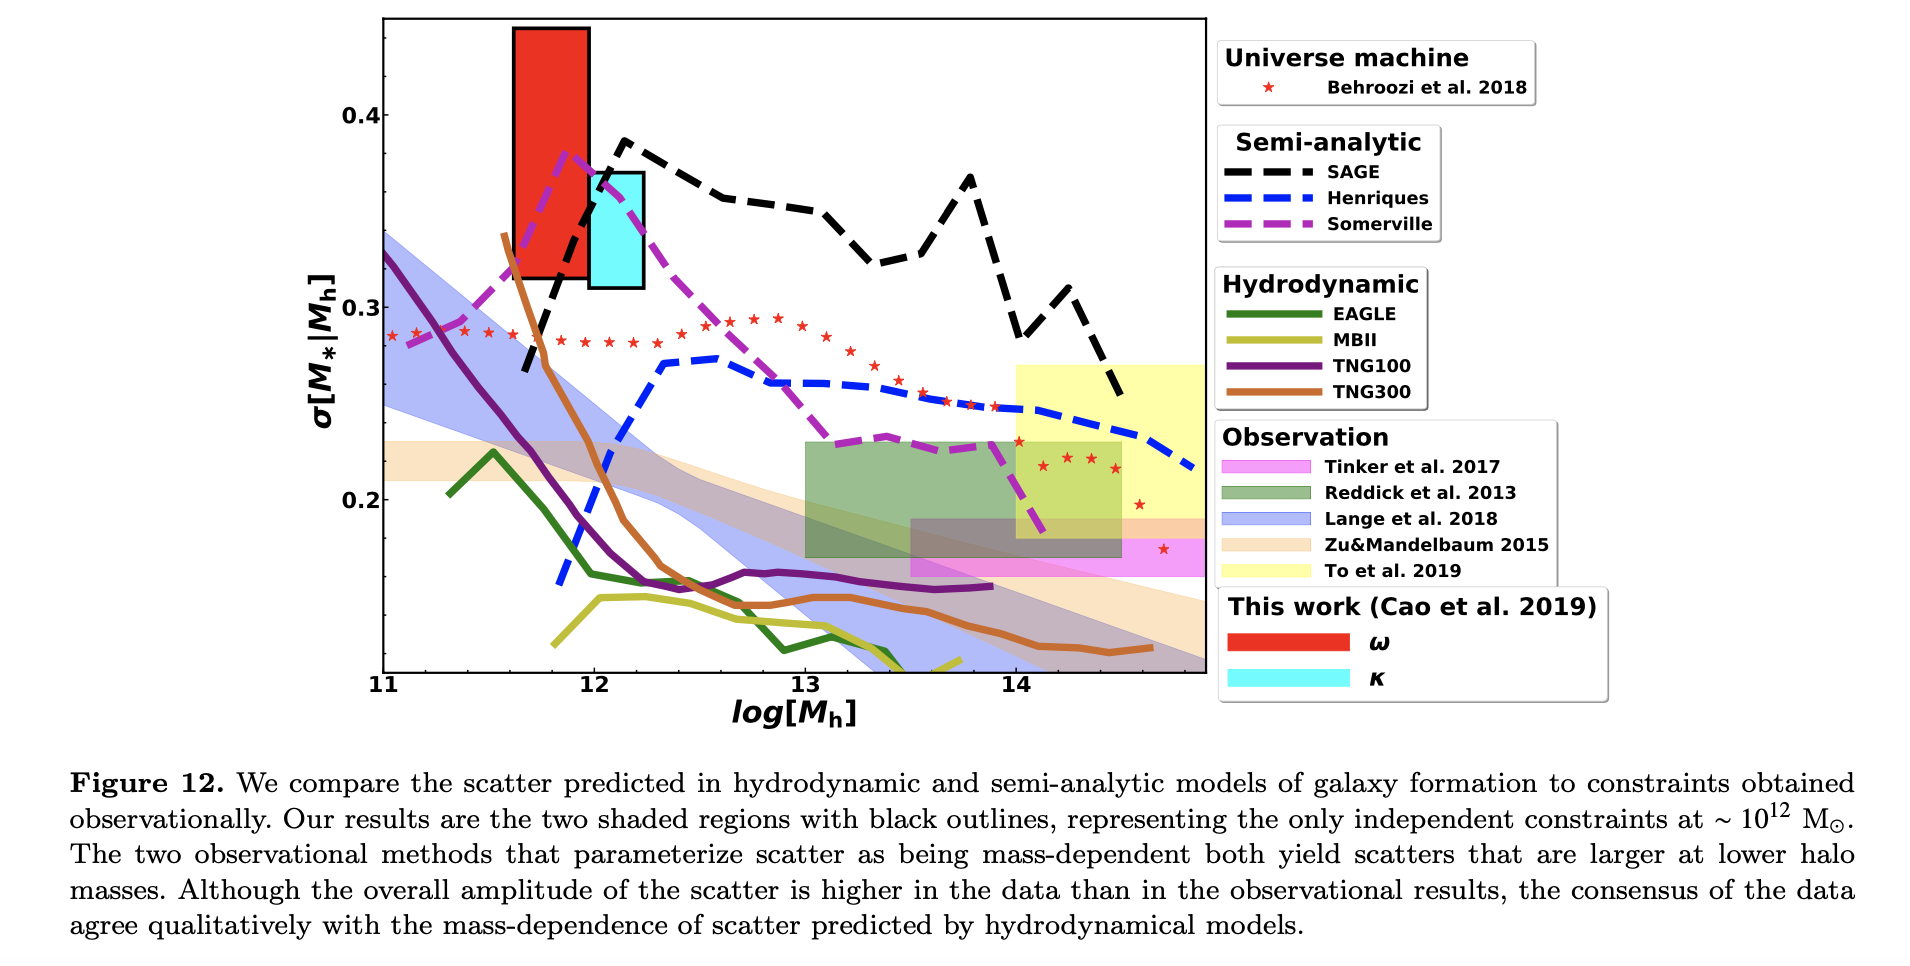
Not only is my method for putting scatter on \(V_{\rm peak}\) not completely working, it also isn’t clear (1) how this will relate to scatter in the SMHM relation and (2) what scatter we want. I really want to sort out this step to get this section of the methods done. After assigning galaxy masses, the next step will be to assign galaxy properties.
To-Do
SMF
(1) Do we want to update/change the Williams SMF parameterizations?
(2) Is there somthing off with the recovered SMFs at low redshifts?
HVF
(3) Update the HVF to agree for higher redshifts.
Scatter Mapping
(4) Decide what scatter I want… right now I am setting it to \(\sigma [M_{\rm gal}\rvert V_{\rm peak}]=0.2\, \rm{dex}\).
(5) Get my procedure for scatter working for all redshifts.
SMHM Relation
(6) Compare these results to the literature, to check that this looks reasonable.
Other
(7) Check that the clustering and/or bias look right.