Nicole Drakos
Research Blog
Welcome to my Research Blog.
This is mostly meant to document what I am working on for myself, and to communicate with my colleagues. It is likely filled with errors!
This project is maintained by ndrakos
Bubble Size Distribution
I have working code that calculates the size of an ionized bubble around each galaxy, given the number of ionizing photons it creates as a function of time. This calculation assumes that each bubble evolves in isolation, and that density of hydrogen in the IGM can be approximated as the average hydrogen density.
With this calculation, the neutral fraction of the Universe is too large between redshifts ~5–8, as I examined in the previous post.
Some possible reasons for this are (1) I am making a mistake in my calculation or (2) this approach tends to underestimate bubble sizes, and I need to relax some of my assumptions. In the current post I will see how the distribution of these individual bubble sizes compare to similar calculations in the literature, to verify that I am performing the calculation correctly.
PDF of DREaM Bubble Sizes
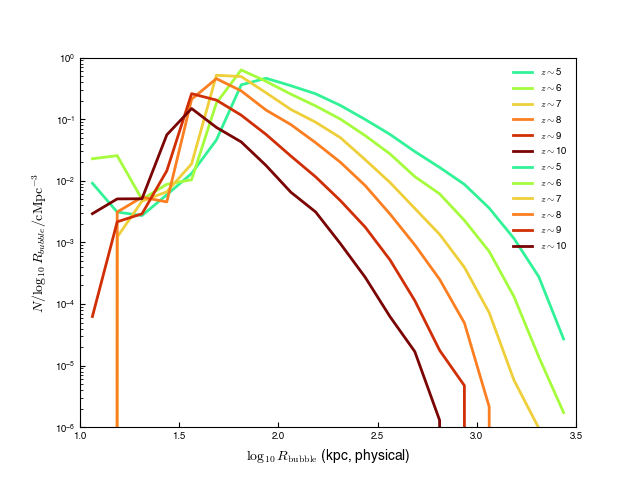
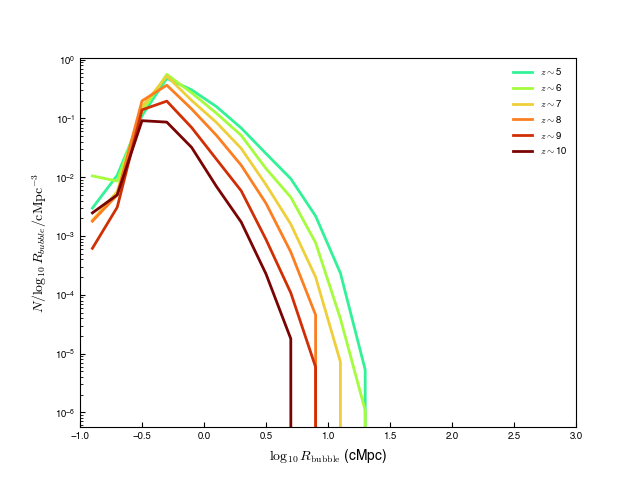
Here are my galaxy distributions:
Comparison to Yajima+2018
I am closely following the method of Yajima et al 2018. Here is there size distribution (their Fig 3):
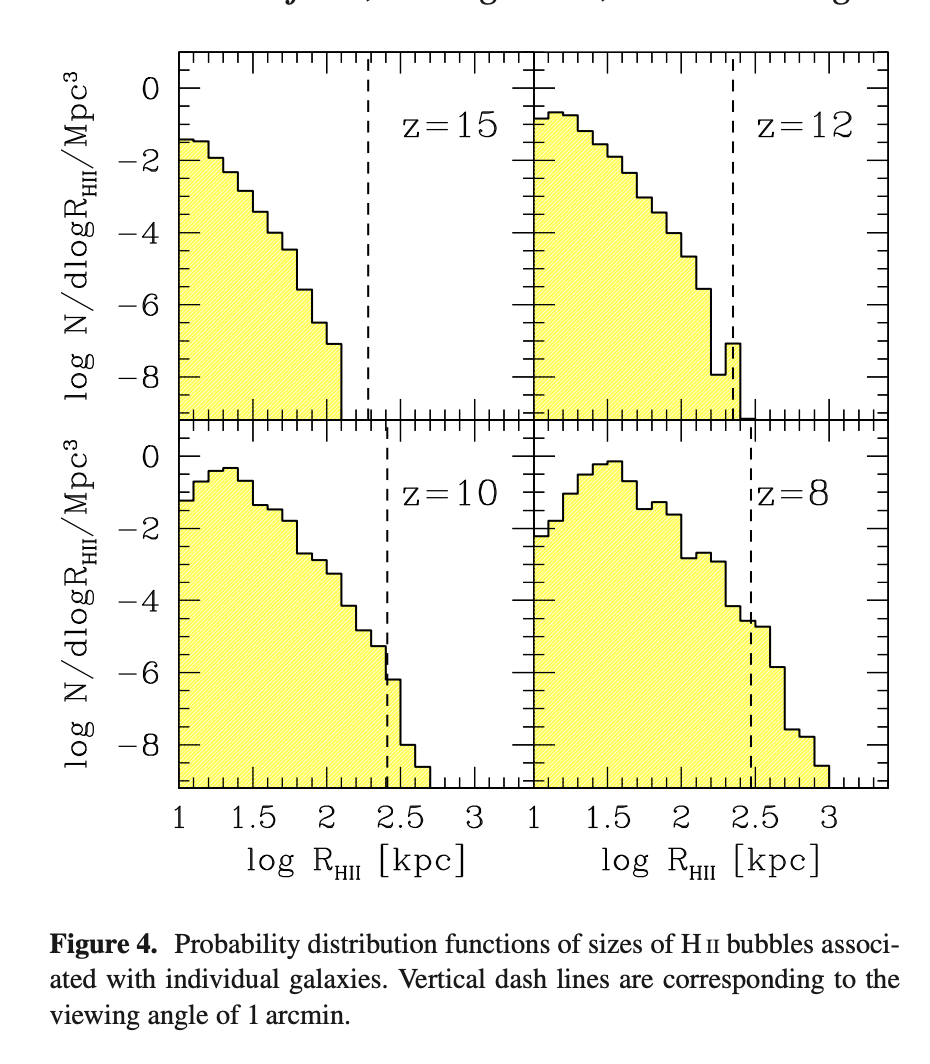
I actually find my bubbles are a bit larger. So these seem to be okay. However, this plot doesn’t compare to redshifts <8, which is where my neutral fraction deviates from the “correct” answer.
Comparison to Lu+2023
Next I will compare to the recent (and very relevant!) paper, Lu et al. 2023, where they consider a slow case (similar to our case i), and a fast case (similar to our case ii). They find:
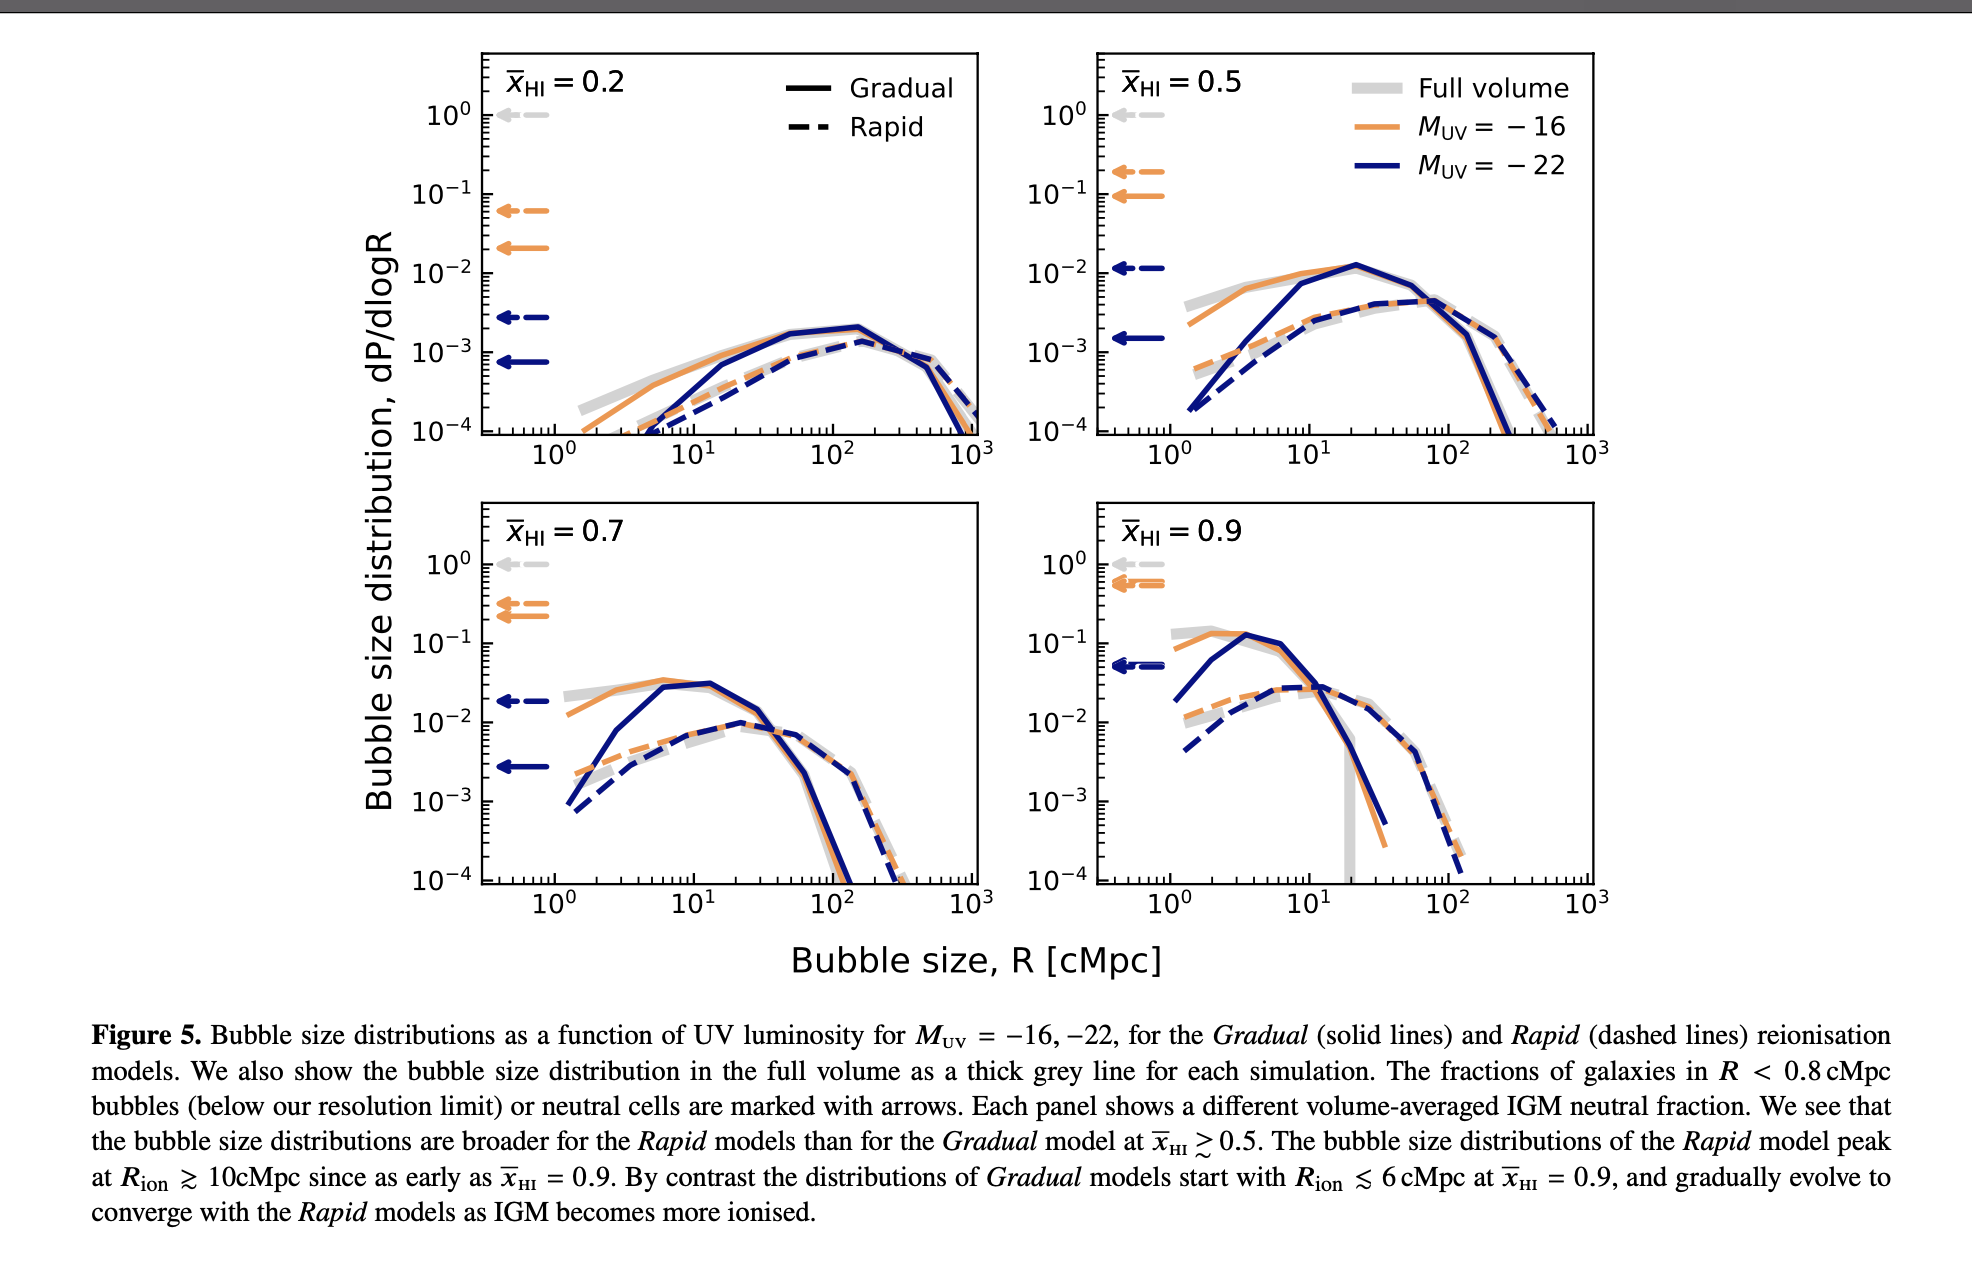
Their bubble sizes are much larger than mine. As they say in their paper “commonly used approaches for modelling the bubble size distribution, i.e. the excursion set formulation (Furlanetto et al. 2004b; Furlanetto & Oh 2005) or approaches which grow cosmological Stromgren spheres around halos (e.g., Yajima et al. 2018) will underestimate the largest bubble sizes because these approaches do not include the effect of overlapping bubbles.”, and that this can change things by more than an order of magnitude.
However, with the modelling approach I am using, I don’t need to get the final overlapping bubble sizes, so this might be okay, as long as this doesn’t effect how the bubble grows in isolation.
Lu+2023 demonstrates the differences in these approaches in the following figure:
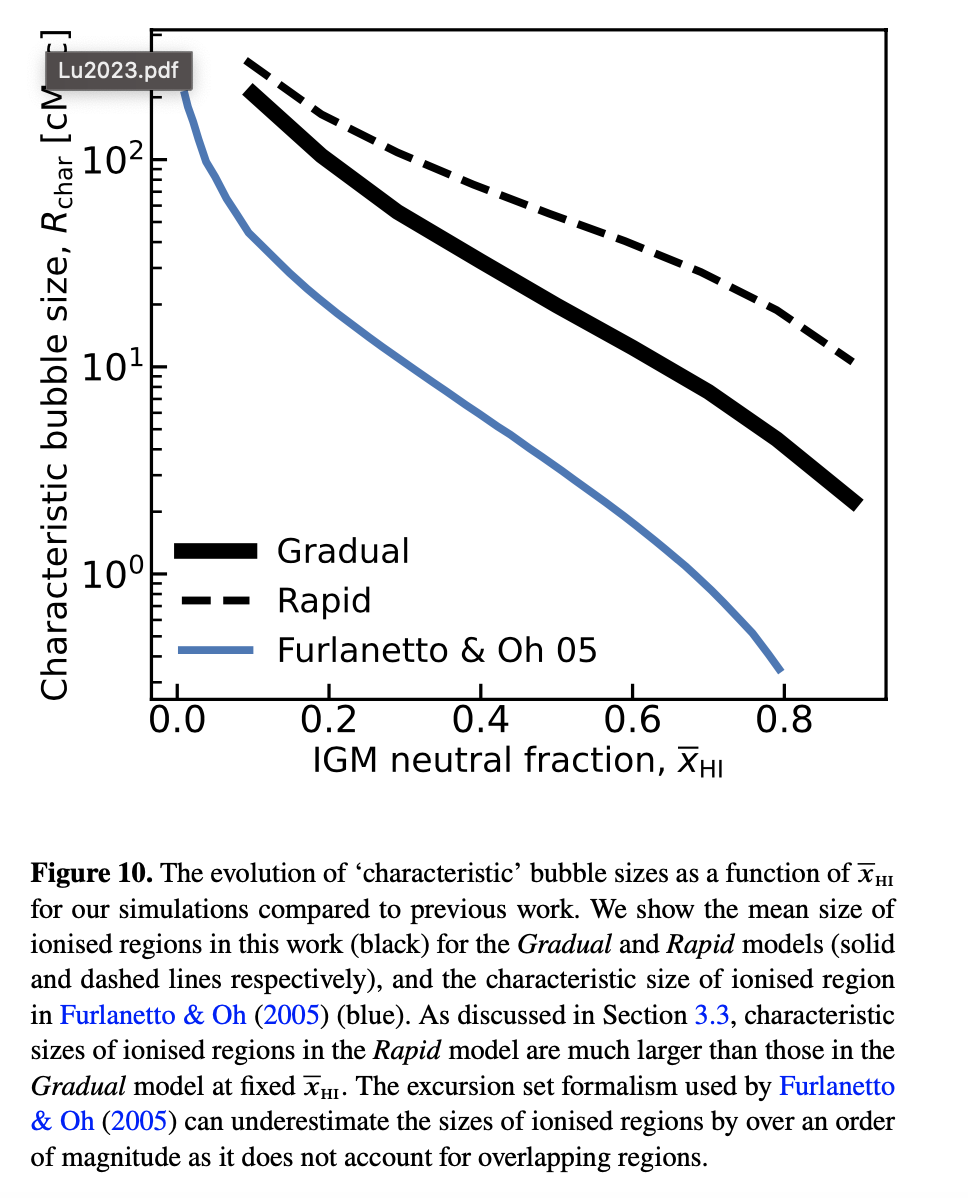
So really what I want is for my findings to be consistent with the Furlanetto & Oh 2005 line. This means the “characteristic” size should be ~100 cMpc by redshift 6. This means my bubbles are definitely not growing properly.
Note that I am not using an excursion set formula, like in Furlanetto&Oh, but am using a Stromgren sphere calculation.
So the question is whether my bubbles are smaller than the Furlanetto & Oh curve because (1) the Stromgren sphere approach or (2) I am doing the Stromgren sphere calculation wrong somehow.