Nicole Drakos
Research Blog
Welcome to my Research Blog.
This is mostly meant to document what I am working on for myself, and to communicate with my colleagues. It is likely filled with errors!
This project is maintained by ndrakos
The Intrinsic Production Rate
The ionizing photon production efficiency, \(\xi_{\rm ion}\), is one of the main quantities we need to calculate for the simulated galaxies (see this post).
The ionizing photon production efficiency
As outlined in Naidu et. al 2020, \(\xi_{\rm ion}\) can be calculated directly from the SED:
\[\xi_{\rm ion} = \frac{N(H^0)}{L_{1500}} [\rm Hz/erg ]\]This is done by:
- integrating the flux produced below the Lyman limit (912 Angstroms) to get \(N(H^0)\) [photons/s/Hz]
- normalizing by the UV Luminosity/SED-flux at 1500 Angstroms [ergs/s]
My calculation
Given a rest-frame SED \(f_{\nu}\) in units of [luminosity/frequency] (FSPS by default does not include the distance; with a distance modulus this can be converted to the usual units \(ergs/Hz/cm^2/s\)) as a function of wavelength, \(\lambda\), I calculated:
\[N(H^0) = \int_{\nu_{912}}^{\nu_{0}} \dfrac{f_\nu \nu}{h \nu} {\rm d} \nu = \int_{0}^{912} \dfrac{f_\nu \nu}{h \lambda} {\rm d} \lambda\]and
\[L_{1500} = \dfrac{\int_{1450}^{1550} f_\lambda {\rm d} \lambda}{100}\]Results
I took the DREaM catalog cut with \(M_{\rm gal}>10^{10} M_{\odot}\) (to make it more manageable for testing), and calculated \(\xi_{\rm ion}\) from each galaxy, as outlined above.
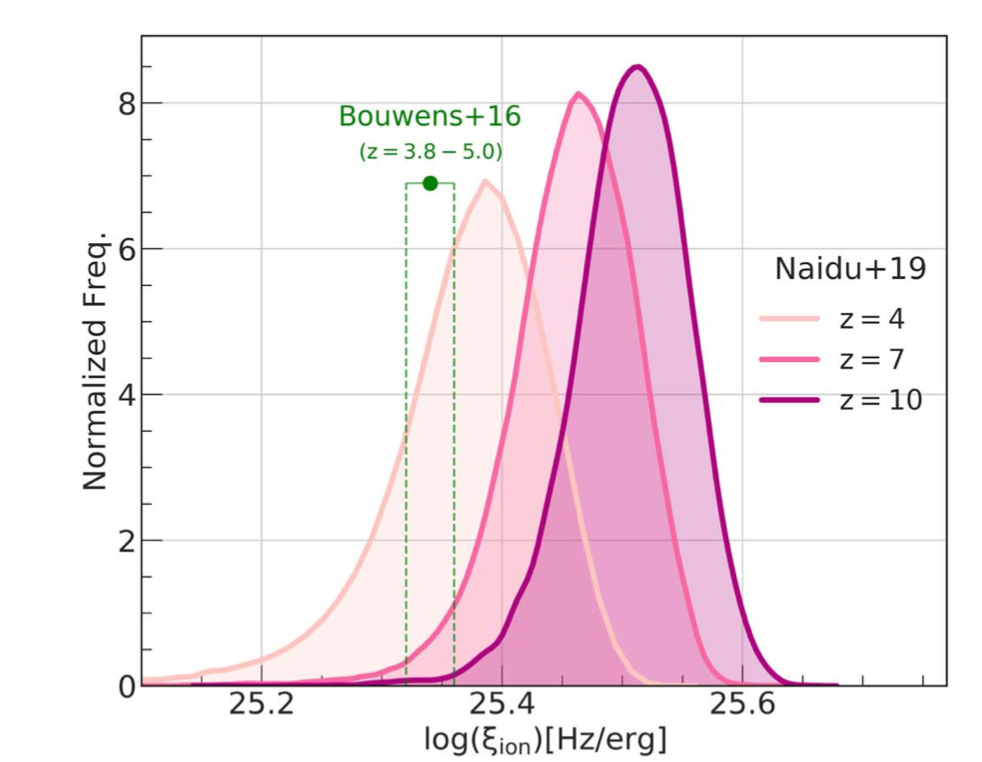
Here is the distribution I expect (from Fig 2 of Naidu et al. 2020):

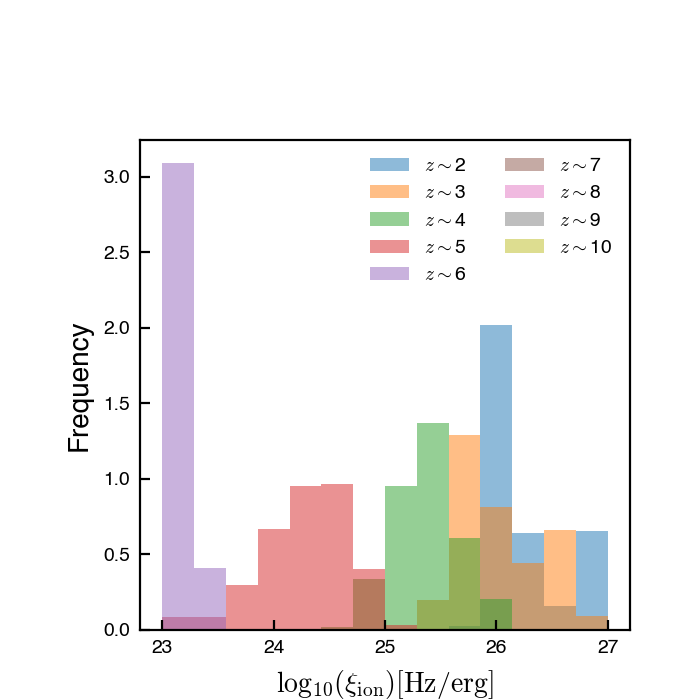
Here is the distribution of \(\xi_{\rm ion}\) I get:

I truncated the plot at \(\xi_{\rm ion}=23\), to see the results a bit better. This means I am not showing the higher redshift data (z>6). My calculation agrees with the Naidu model, and the Bouwens data around redshift 4, but I get a lot more variation. I’m not sure whether this is because I made a mistake in the calculation or because of modelling differences.
Next steps
- Triple check my \(\xi_{\rm ion}\) calculation
- Check the literature to see if mine or Naidu’s results are more consistent with observations
- Look to see what SED modelling assumptions will most strongly affect \(\xi_{\rm ion}\)