Nicole Drakos
Research Blog
Welcome to my Research Blog.
This is mostly meant to document what I am working on for myself, and to communicate with my colleagues. It is likely filled with errors!
This project is maintained by ndrakos
Topology of Reionization
Here I am looking at the topology of reionization in my model, as described in the last post.
Running on the full DREaM Simulation
I calculated the bubble sizes for the full catalog. This took about ~13 hours to run on ~600 processors on lux.
Distribution of Bubble Sizes
Here is the distribution of sizes:

This looks like what I would expect from this post, but I want to do a more careful comparison.
Topology
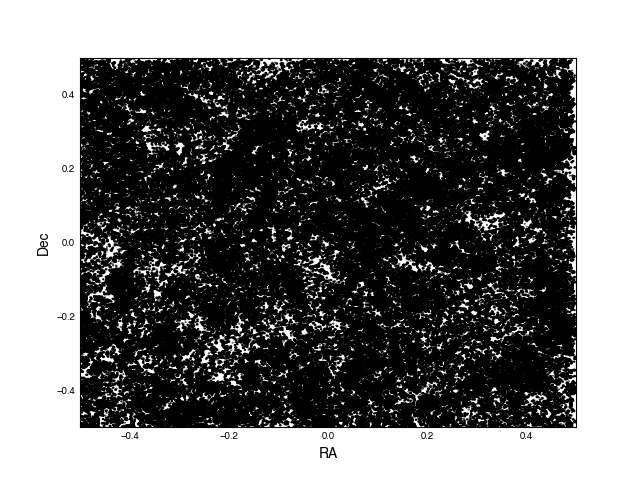
If I plot all the galaxies between redshifts 10.5 and 11.5, I find

The Universe should be less than 10% ionized at this time, so this does NOT look right. However, this could be due to plotting issues.
Plotting issue 1: projection effects (i.e. z-direction cross section is too large)
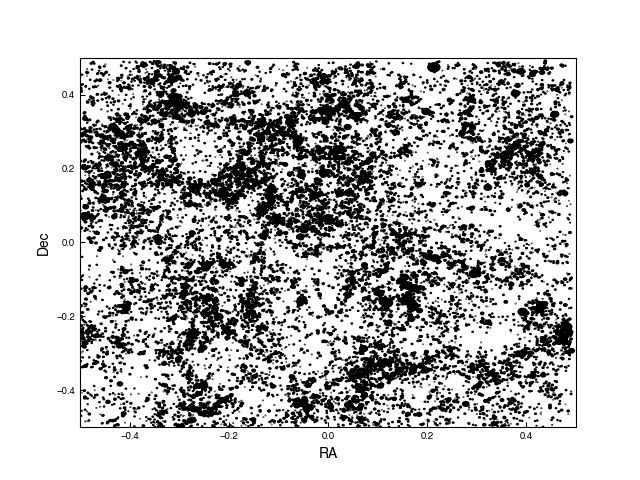
If I take galaxies between redshifts 10.9 and 11.1, I find:

Clearly this makes a very large difference, and projecting the bubbles down is not the right way to go about this calculation.
Because galaxies with very small bubbles are appearing as pixel-sized circles
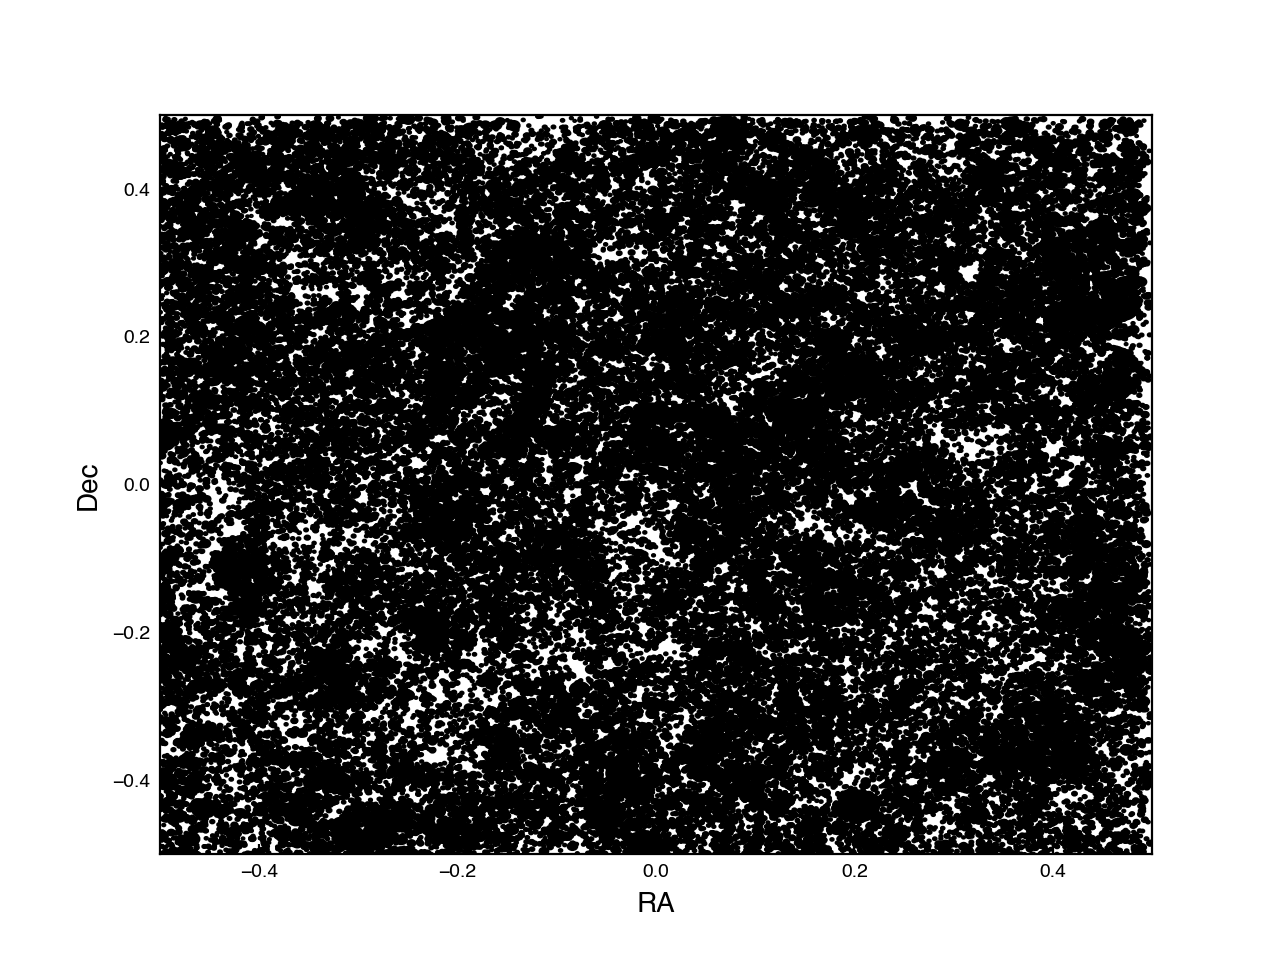
If I again take galaxies between 10.5 and 11.5, but only plot galaxies with bubble radii greater than 0.001 degrees, and specify a dpi of 200, I find:

This again made some difference. I need to think about what resolution I want this plot to be, and the size of bubbles this will correspond to.
How to plot this better?
Next, I want to try and get a more accurate way of plotting this, and also be able to properly calculate the ionized volume as a function of redshift.
I think that the easiest way to do this will be to have a 3D grid of points in RA, Dec and z that I initialize to False. I can loop through the galaxies, and change a grid point to “True” if it is within the radius of the galaxy. This will then make it easy to take a cross-section that does not depend on projection effects, or on galaxies that are smaller than the pixelization scheme. It will also be very straightforward to calculate the ionized area as a function of redshift.
This proposed method might be a bit slow, but should be completely doable. I’ll try and do it with numpy arrays rather than a loop if possible.