Nicole Drakos
Research Blog
Welcome to my Research Blog.
This is mostly meant to document what I am working on for myself, and to communicate with my colleagues. It is likely filled with errors!
This project is maintained by ndrakos
Topology of Reionization Part II
As I described in the previous post, I want to plot the reionized regions.
Brute Force Approach
As I described previously, I could (1) define a 3D grid of points (2) loop through galaxies and calculate the distance to each grid point (3) find all grid points that were less than the bubble size.
This is very slow for even one galaxy, and not feasible to use.
There are possible ways I could speed this up (e.g., using kd trees, or assuming the spheres are squares instead of spheres). However, these don’t really speed things up as much as I would like, and I don’t actually think its necessary.
Calculate the Topology in a Plane
It probably makes more sense to only plot galaxies in the plane I am interested in!
The new method is to (1) choose a redshift (2) only take galaxies that bubbles intersect this plane (3) find the cross-section of the sphere that intersects this plane (4) loop through these galaxies and plot the spheres.
Here are the results (for redshifts 5,6,7,8,9,10):
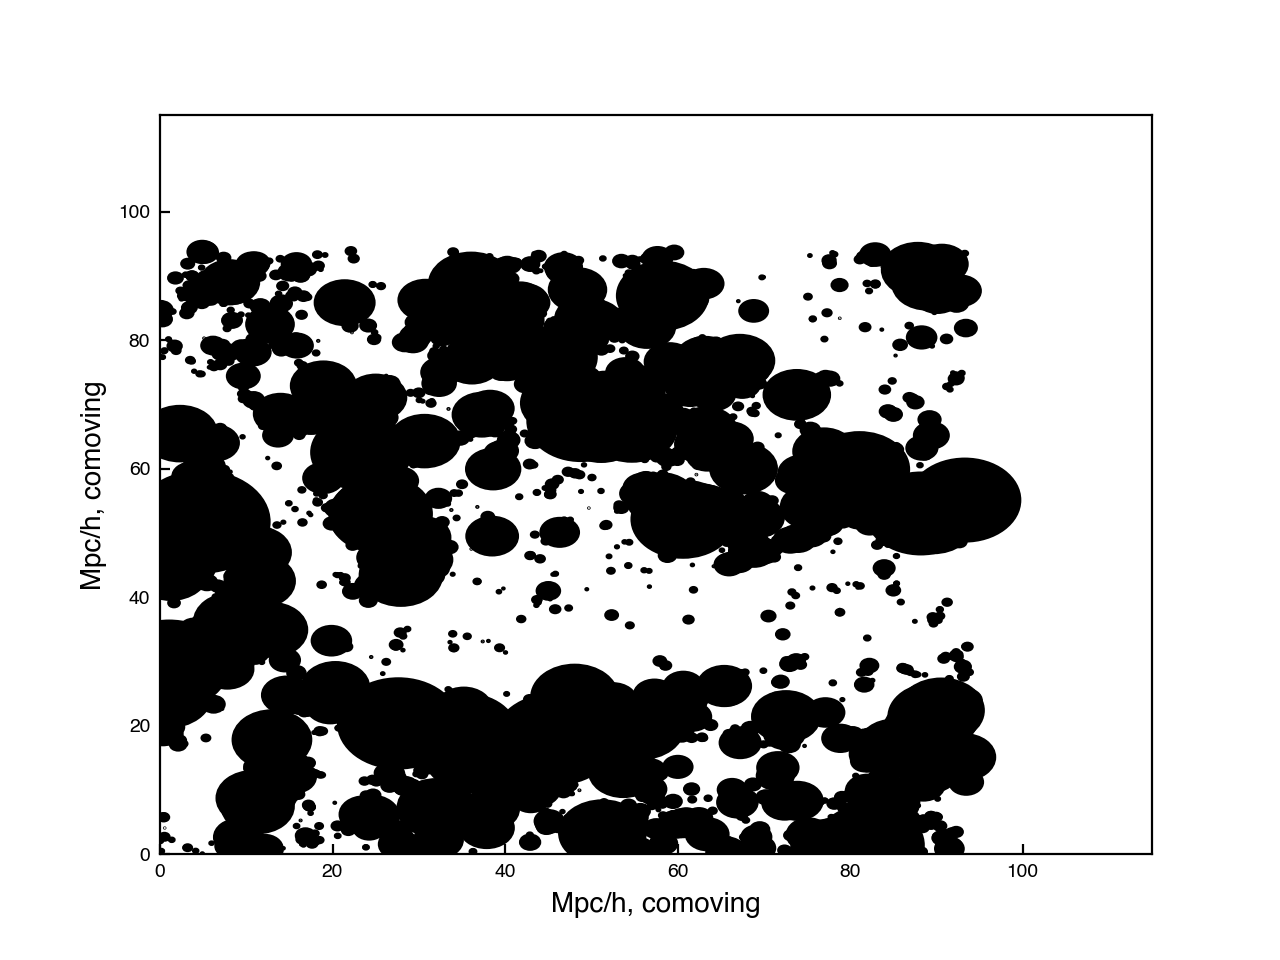
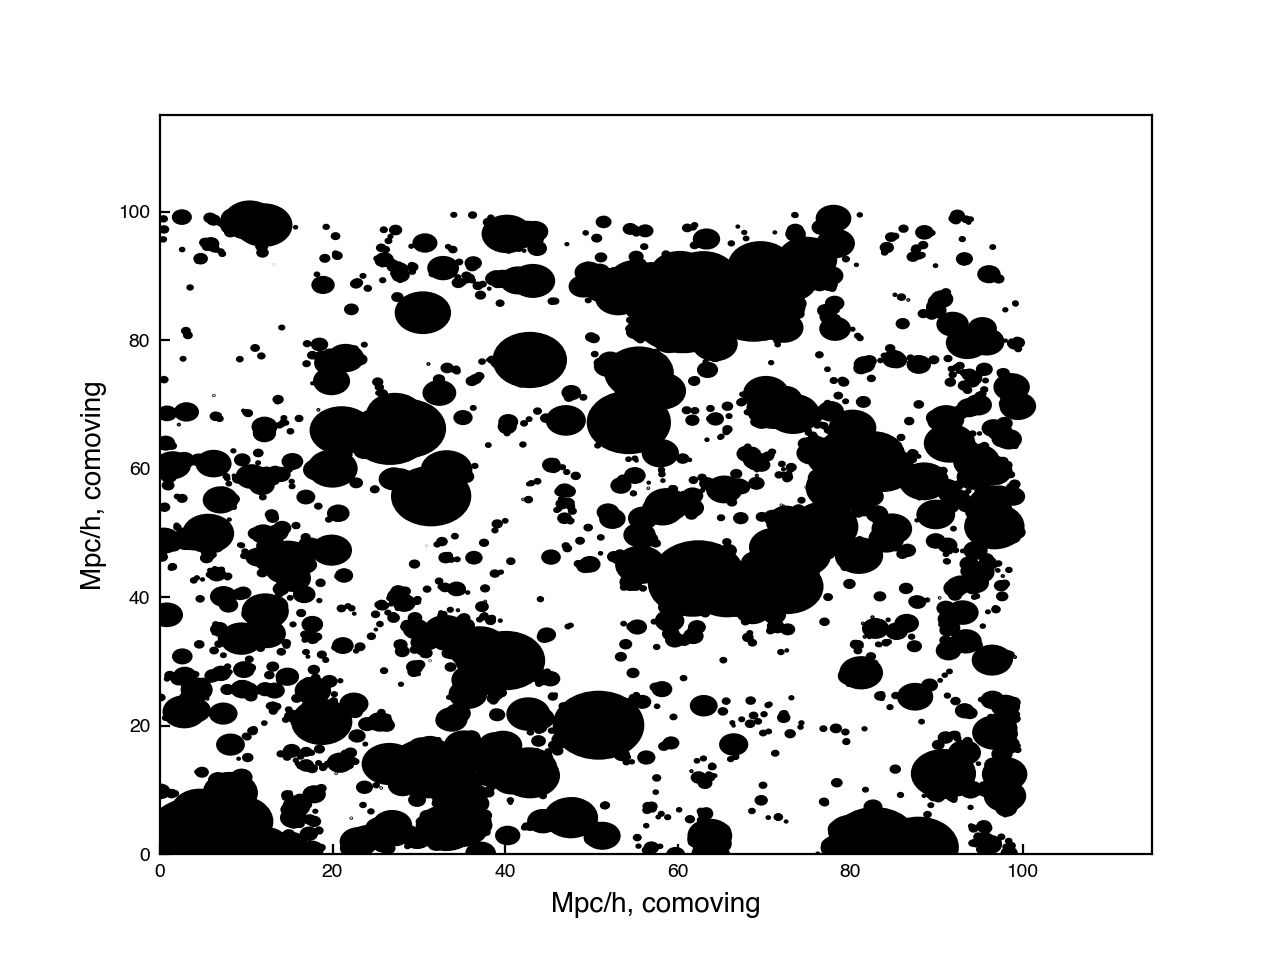
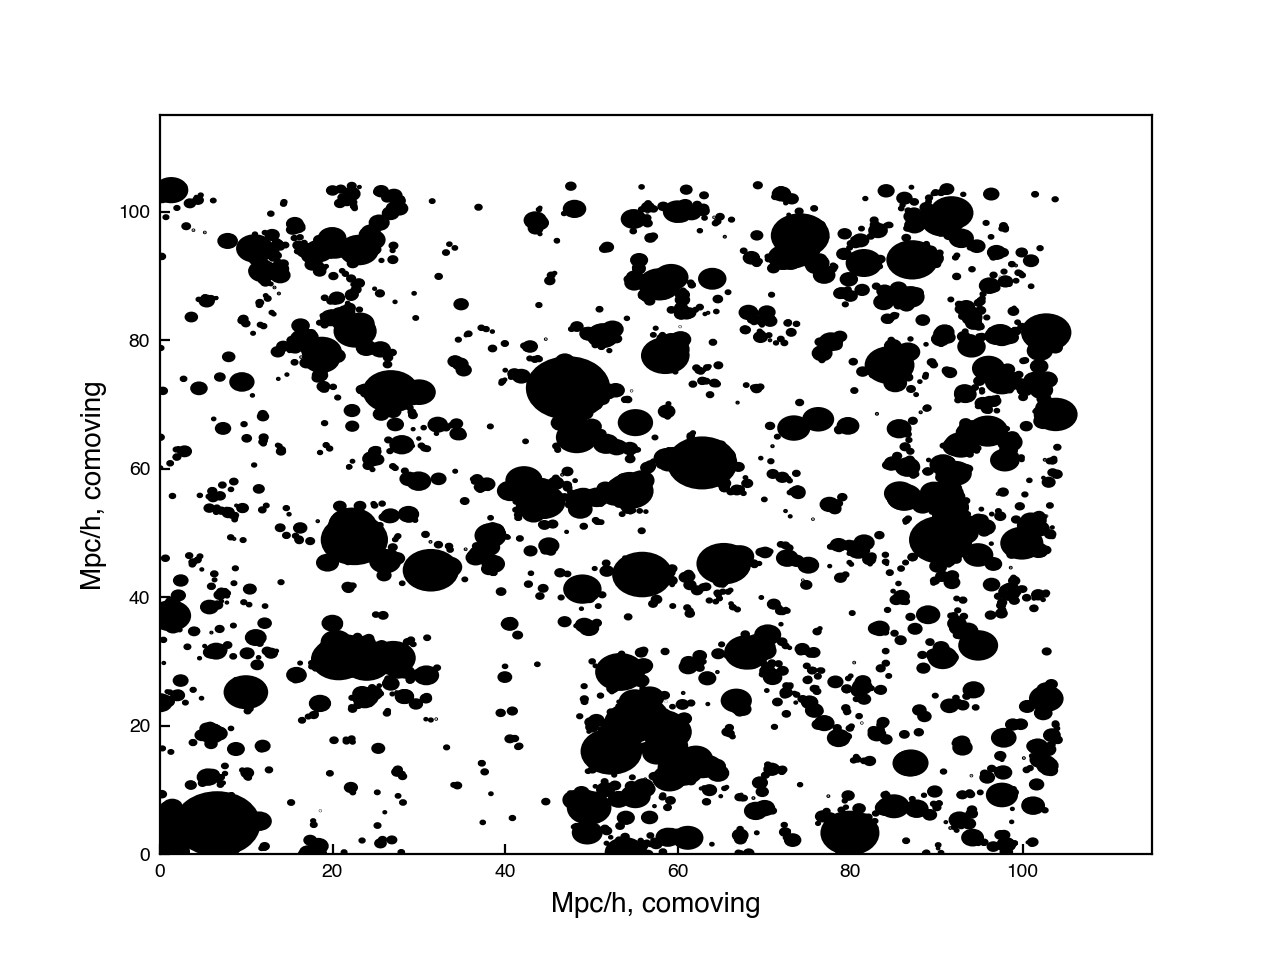
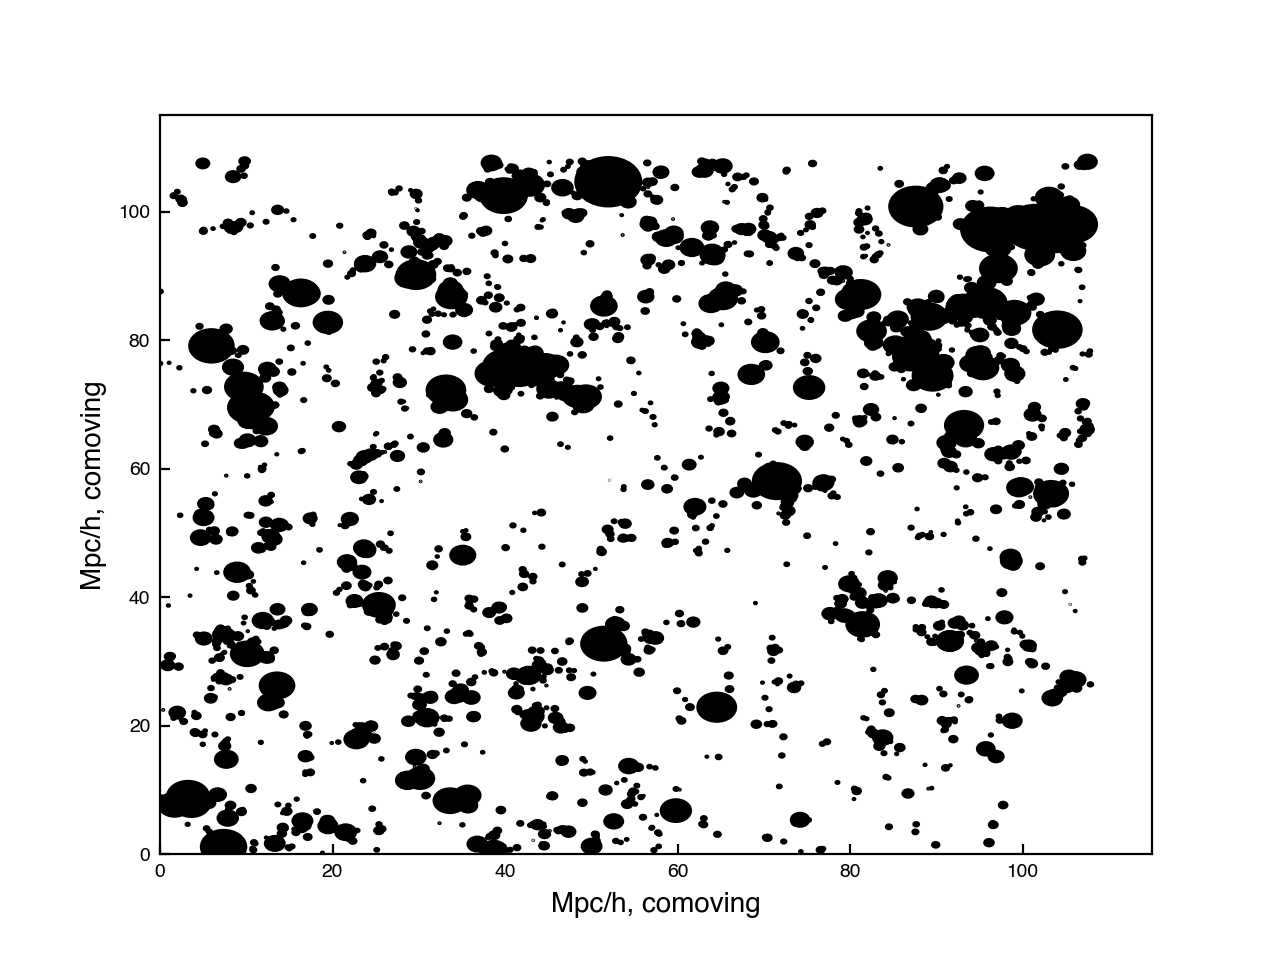
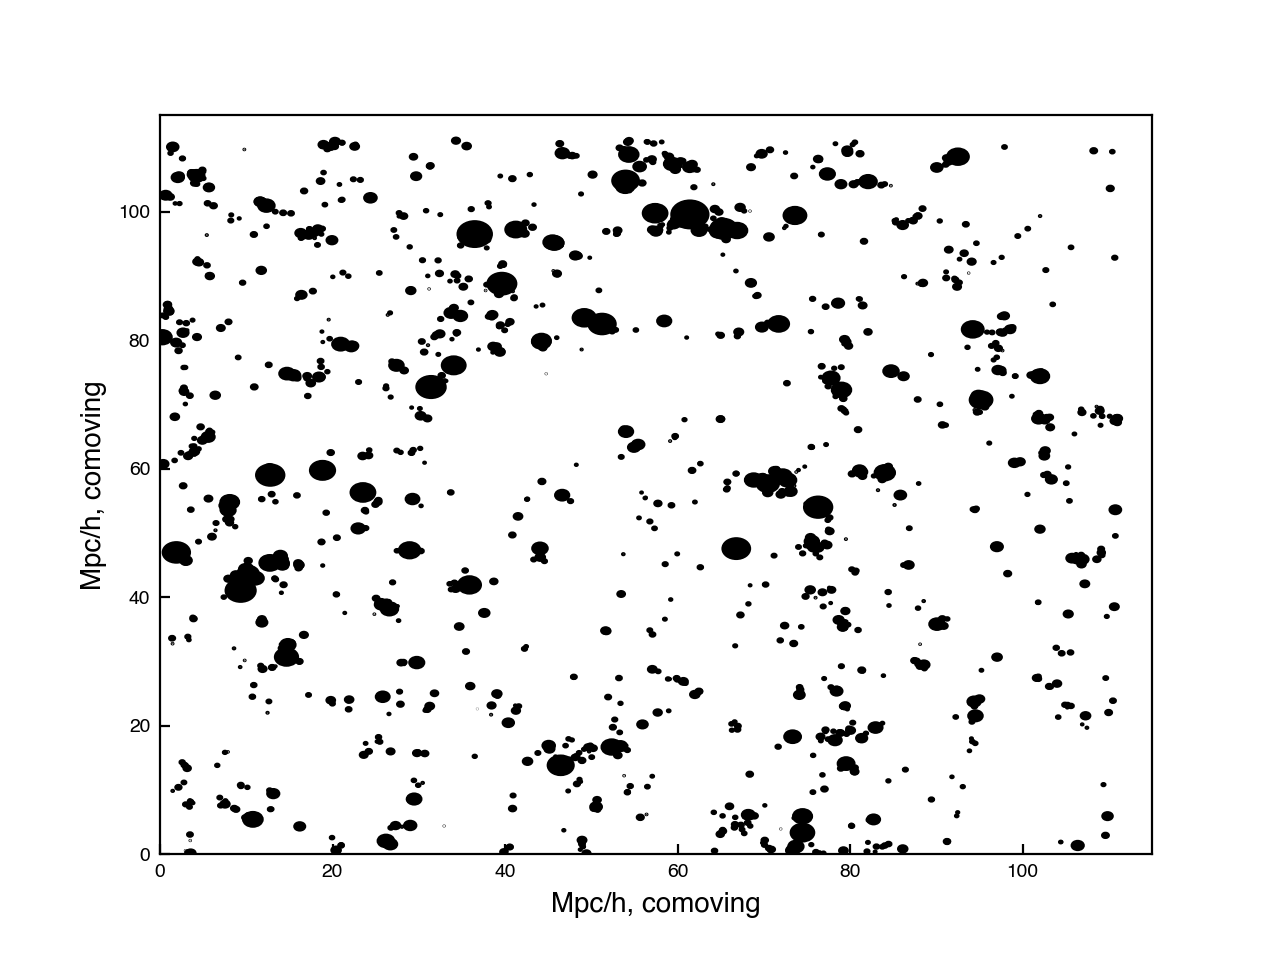
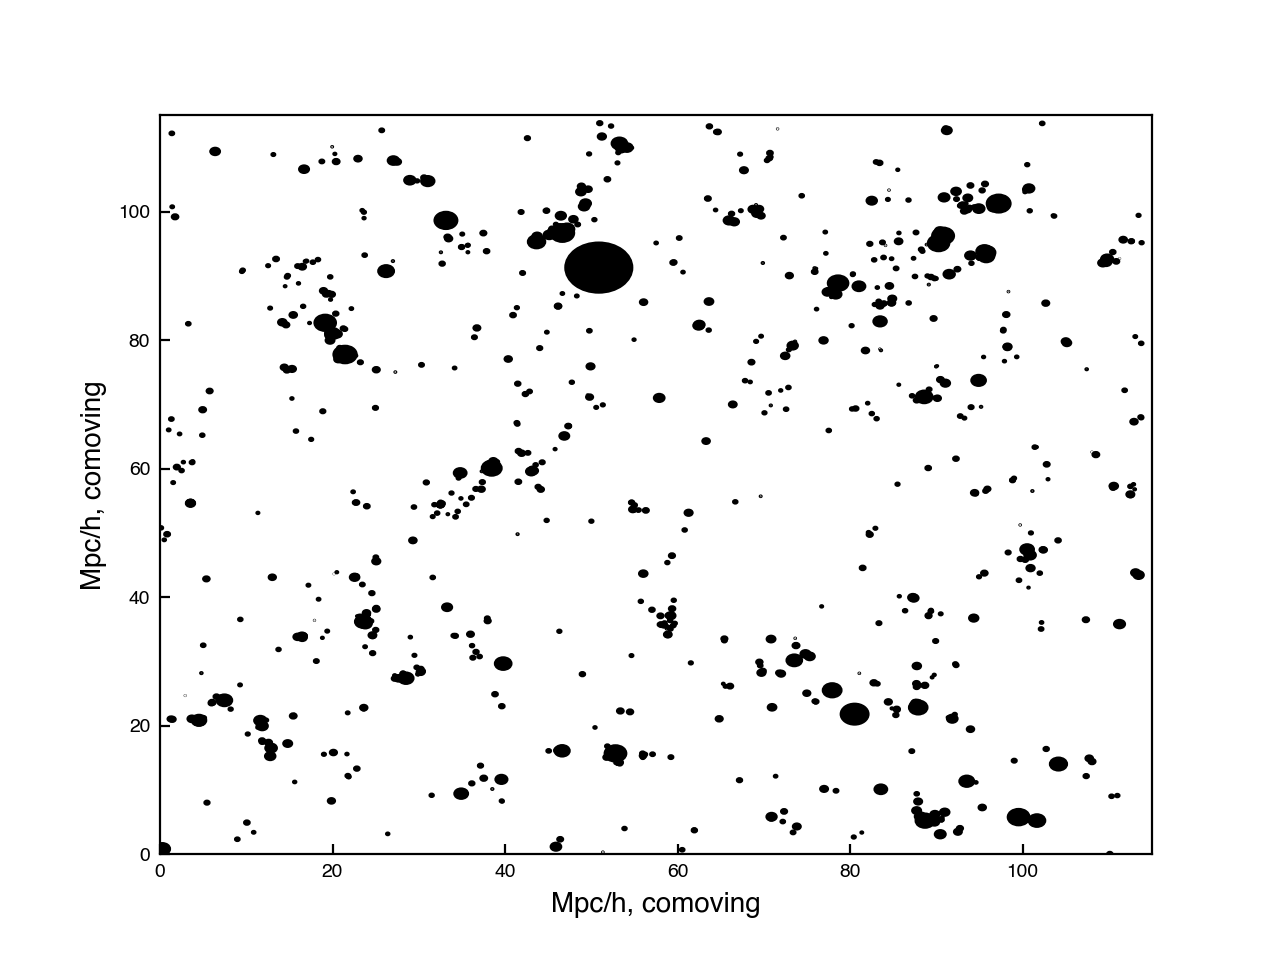
These look pretty good, but I expected the ionized regions to be slightly larger. By redshift 6, I would expect it to be almost completely ionized.
Next Steps
- Calculate percentage of the area that is ionized in these planes.
- Do some careful comparisons of the bubble size distributions, to make sure they look correct, and that I don’t have any errors in the calculation.