Nicole Drakos
Research Blog
Welcome to my Research Blog.
This is mostly meant to document what I am working on for myself, and to communicate with my colleagues. It is likely filled with errors!
This project is maintained by ndrakos
Galaxy Clustering Lightcone
In a previous post I outlined how to calculate the two-point correlation function (2PCF) on a simulation volume (note there were some errors in that post). Here I am going to go through calculating the 2PCF on the light cone.
Generating a Random Distribution
The survey is a pyramid of height \(d_{\rm max}\) and length/width of \(d_{\rm max} \sin \theta\), where \(\theta\) is the survey volume (see this post).
I generated uniformly distributed points in this volume by
(1) picking a comoving distance \(d = d_{\rm max} {\rm rand}^{1/3}\), where \({\rm rand}\) is a random number between 0 and 1.
(2) picking \(y\) and \(z\) coordinates as \(y_{\rm rand} = d \sin(\theta) ({\rm rand}-0.5)\)
(3) Convert these to RA, DEC and distance as in this post
Is this correct? Should they be uniformly distributed in comoving coordinates?
Results
I am using the package Corrfunc. Corrfunc has instructions on how to calculate the projected correlation function for mock catalogs here.
I took all the galaxies in different redshift bins and plotted the correlation functions.
Here are the results:
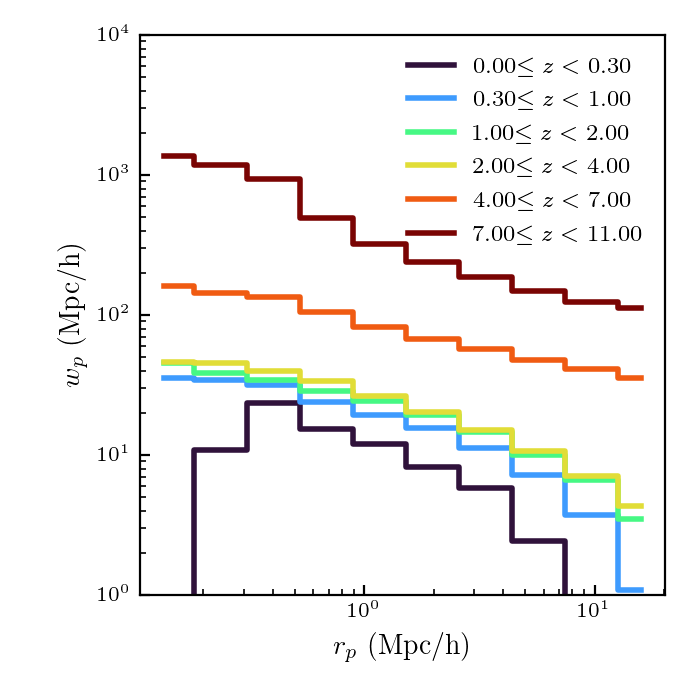
I should double check all the input parameters, and also figure out how to put error bars on these. I also want to check the lowredshift results against SDSS measurements.
Also, I think the trend is opposite to what it should be in redshift…