Nicole Drakos
Research Blog
Welcome to my Research Blog.
This is mostly meant to document what I am working on for myself, and to communicate with my colleagues. It is likely filled with errors!
This project is maintained by ndrakos
Initial Conditions
Here I am going to take a closer look at the initial conditions used to generate this test simulation. There are a few things I want to look into:
1) Why do the ICs look grid-like? Is this because of the ICs, or just how I am plotting them?
2) Does the transfer function make a difference to the predicted halo mass function?
3) Does the power spectrum of the ICs look right?
4) Is the reason the HMF from the simulations is a little high because of the random realization?
Grid-like ICs
My plot of the simulation at snapshot_000 (redshift 20) looks like this:
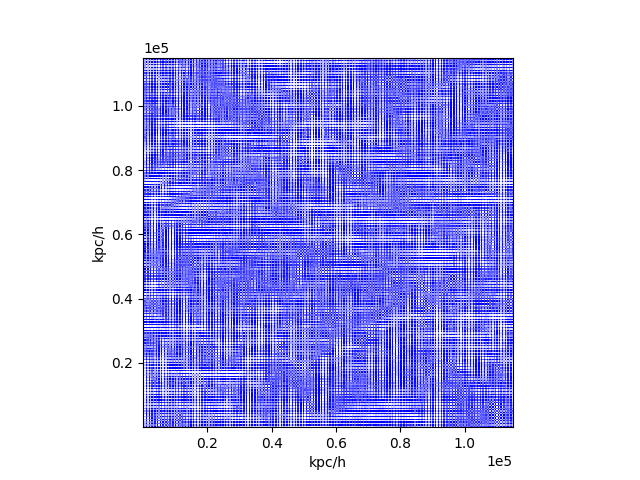
I want to see if this is because of the plotting function I am using, or if there is a problem in the ICs.
To test this, I calculated the density myself (I binned up the particles, and calculated the density in x-y projection):
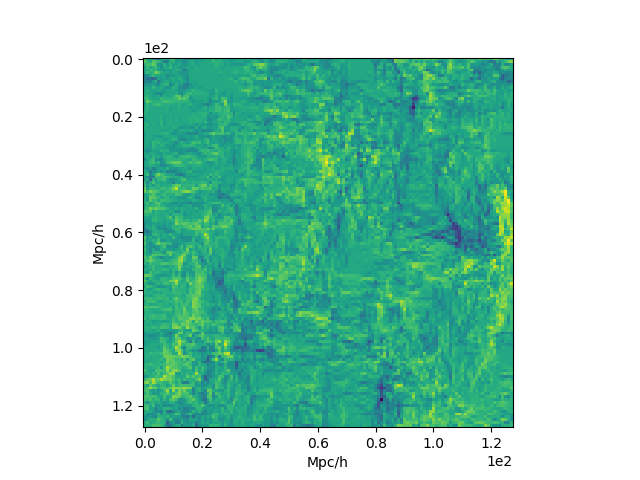
This looks good, so the grid-like structure does seem to be an issue with the plotting function.
Transfer Functions
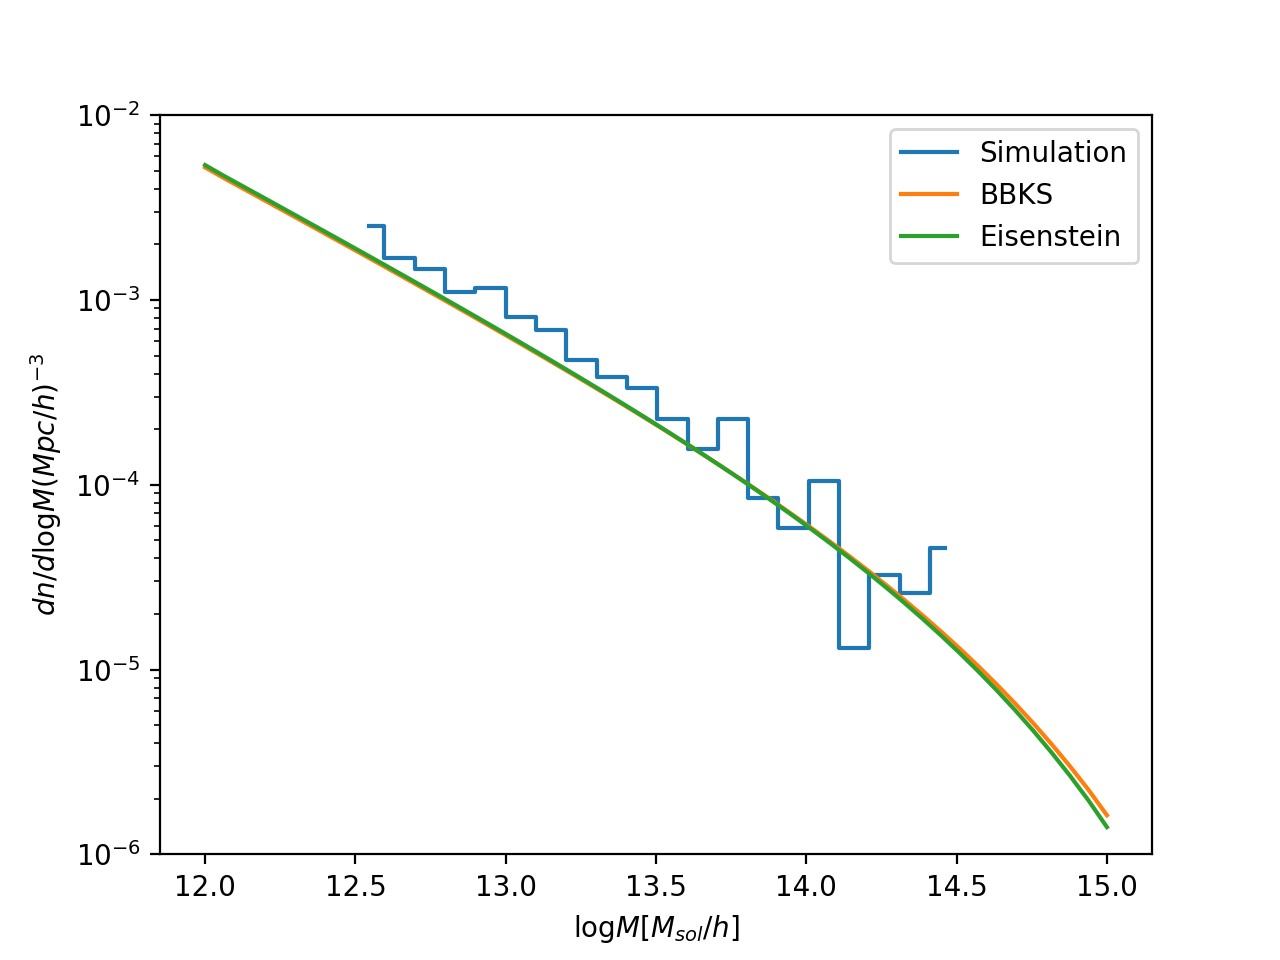
I went through the calculation for the halo mass function (HMF) in this post and used the transfer function from BBKS.
For the ICs, I am using the Eisenstein transfer function (Equation 29 of Eisenstein & Hu 1998), and here I have updated my theoretical HMF to include this.
The difference in the theoretical HMF is minimal:
Power Spectrum
I am guessing that the power spectrum of the ICs is just by chance a little too high. In the next post I’ll go through how to measure the power spectrum, and compare it to theory.