Nicole Drakos
Research Blog
Welcome to my Research Blog.
This is mostly meant to document what I am working on for myself, and to communicate with my colleagues. It is likely filled with errors!
This project is maintained by ndrakos
Power Spectrum
This post goes through calculating the matter power spectrum. I found the notes by Cui et al. 2008 useful.
Theoretical Power Spectrum
The power spectrum can be written as:
\[P(k,a) = A k^n T^2(k) D^2(z)\]where \(k\) is the wavenumber, \(T\) is the transfer function, and \(D\) is the growth factor and \(A\) is the amplitude.
I calculated \(A\) from calculating \(\sigma(8 h^{-1}\, {\rm Mpc})\) as in this post (note that there is a factor of \(1/(2 \pi^2)\) that I absorbed into the constant \(A\) in the previous post),
\(T\) was calculated from Equation 29 of Eisenstein & Hu 1998.
\(D(z)\) is equal to:
\[D(z)= A_0 E(z) \int_{z}^{\infty} \dfrac{(1+z')}{E^{3}(z')} d z'\]Assuming a flat universe, \(E(z)=\sqrt{\Omega_{\Lambda}+\Omega_{M}(1+z)^{3}}\), and setting \(D(0)=1\), \(A_0=\left(E(z) \int_{0}^{\infty} \frac{(1+z')}{E^{3}(z')} d z' \right)^{-1}\)
Power Spectrum From \(N\)-Body Simulation
The power spectrum can be calculated from the overdensities:
\[\delta(x) = \dfrac{\rho(x)-\bar{\rho}}{\bar{\rho}}\]I binned the particles in 3D to calculate the density—this corresponds to nearest grid point (NGP) method.
The power spectrum is \(P(k) = \langle \mid \delta_k \mid^2 \rangle\). However, this is for continuous functions. You need to correct for (1) the shot noise and (2) the window function.
The steps I followed are:
(1) find the density on a grid, \(\mathbf{r}_g\)
(2) calculate the density contrast at every position $\mathbf{r}_g$
(3) take the FFT, and calculate \(\mid\delta_k\mid^2\) in each cell
(4) bin \(\mid\delta_k\mid^2\) in \(k\)
(5) find the average in each bin
(6) subtract \(1/N\): this should account for the shot noise (this is effectively zero though, so doesn’t matter)
(7) multiply by the volume, and divide by \(N^2\) (I think this is the right normalization?)
Results
Here are my results:
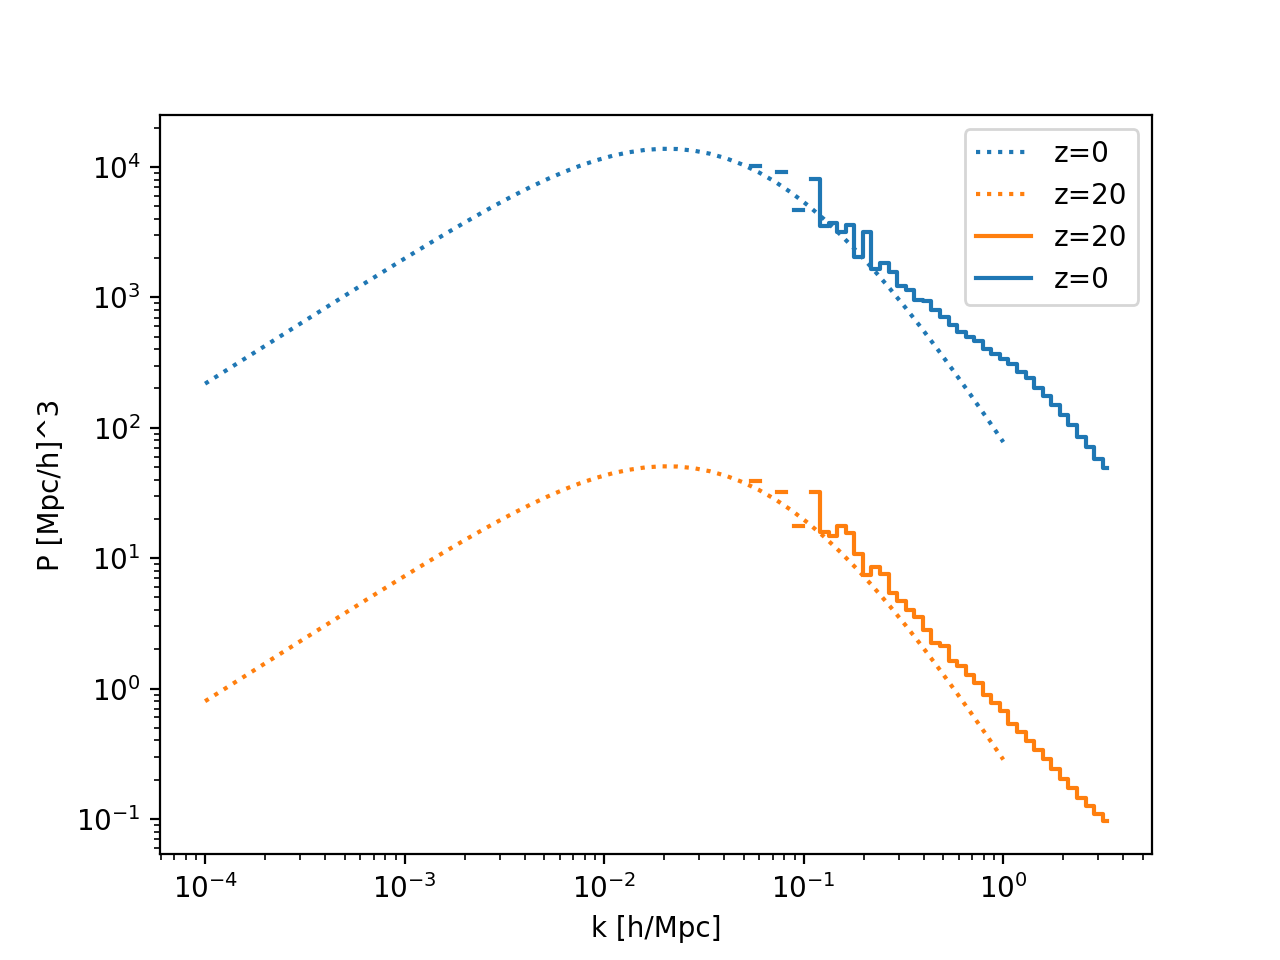
The simulation does look like it is above the theoretical power spectrum, but it is very possible I messed up the normalization on the theoretical and/or the measured power spectrum.
I want to generate a couple more realizations of the ICs and see if they look closer to the theoretical curve.